Building an Autonomous SOC Lab: From Raw Logs to AI-Driven Threat Intelligence

Overview
This document details the design, construction, and operation of a fully functional three-layer Security Operations Center (SOC) lab I built as part of my Final Year Project at KCA University. The platform — which I named the Autonomous SOC AI Platform — runs entirely on a single Windows machine and brings together a real attack environment, a custom-tuned SIEM, and an AI-powered analysis engine.
My role in the project was to build the infrastructure layer: the networks, the SIEM, the detection rules, and the data pipeline that feeds everything into the AI analysis layer built by my teammate Nicole Nyagah. The attack simulation layer was built by my teammate Curtis Okello.
The result is a self-contained, multi-layer security platform with the following components:
- A VirtualBox-isolated attack environment running DVWA (Damn Vulnerable Web Application)
- A Wazuh SIEM deployed on WSL2 Ubuntu, receiving real-time logs from a Windows EDR agent
- Custom detection rules covering 9 MITRE ATT&CK techniques
- A Tailscale mesh VPN providing zero-trust remote access to the entire lab
- A dynamic port forwarding system that survives Windows reboots automatically
This documentation covers every command, every design decision, and every mistake made during the build — with the goal that anyone reading it can replicate the lab and understand not just what to run, but why.
Introduction
Most cybersecurity labs I’ve seen online follow the same tired formula: spin up Kali Linux, run nmap, call it a penetration test. I wanted to build something fundamentally different — a lab that doesn’t just simulate a security environment but actually functions like one.
This post documents the complete construction of a three-layer SOC platform I built for my Final Year Project at KCA University. The platform — the Autonomous SOC AI Platform — is a real-time security bridge that sits on top of a Wazuh SIEM, ingests live attack telemetry generated by a custom APT emulator, and feeds everything into an AI-powered analysis engine built by my teammate Nicole Nyagah. My job was to build the infrastructure that made all of this possible.
What I ended up with:
- A VirtualBox-isolated attack environment running DVWA (Damn Vulnerable Web Application)
- A Wazuh SIEM deployed on WSL2 Ubuntu, receiving real-time logs from a Windows EDR agent
- Custom detection rules covering 9 MITRE ATT&CK techniques
- A Tailscale mesh VPN providing zero-trust remote access to the entire lab
- A dynamic port forwarding system that survives Windows reboots automatically
By the end of this post, you’ll have everything you need to replicate this lab and understand why each design decision was made — not just what commands to run.
Architecture Overview
Before I touched a single command, I made sure I understood the system I was building. Architecture decisions made early have cascading consequences — this is something I learned the hard way.
 Architecture Overview
The Three-Layer Design
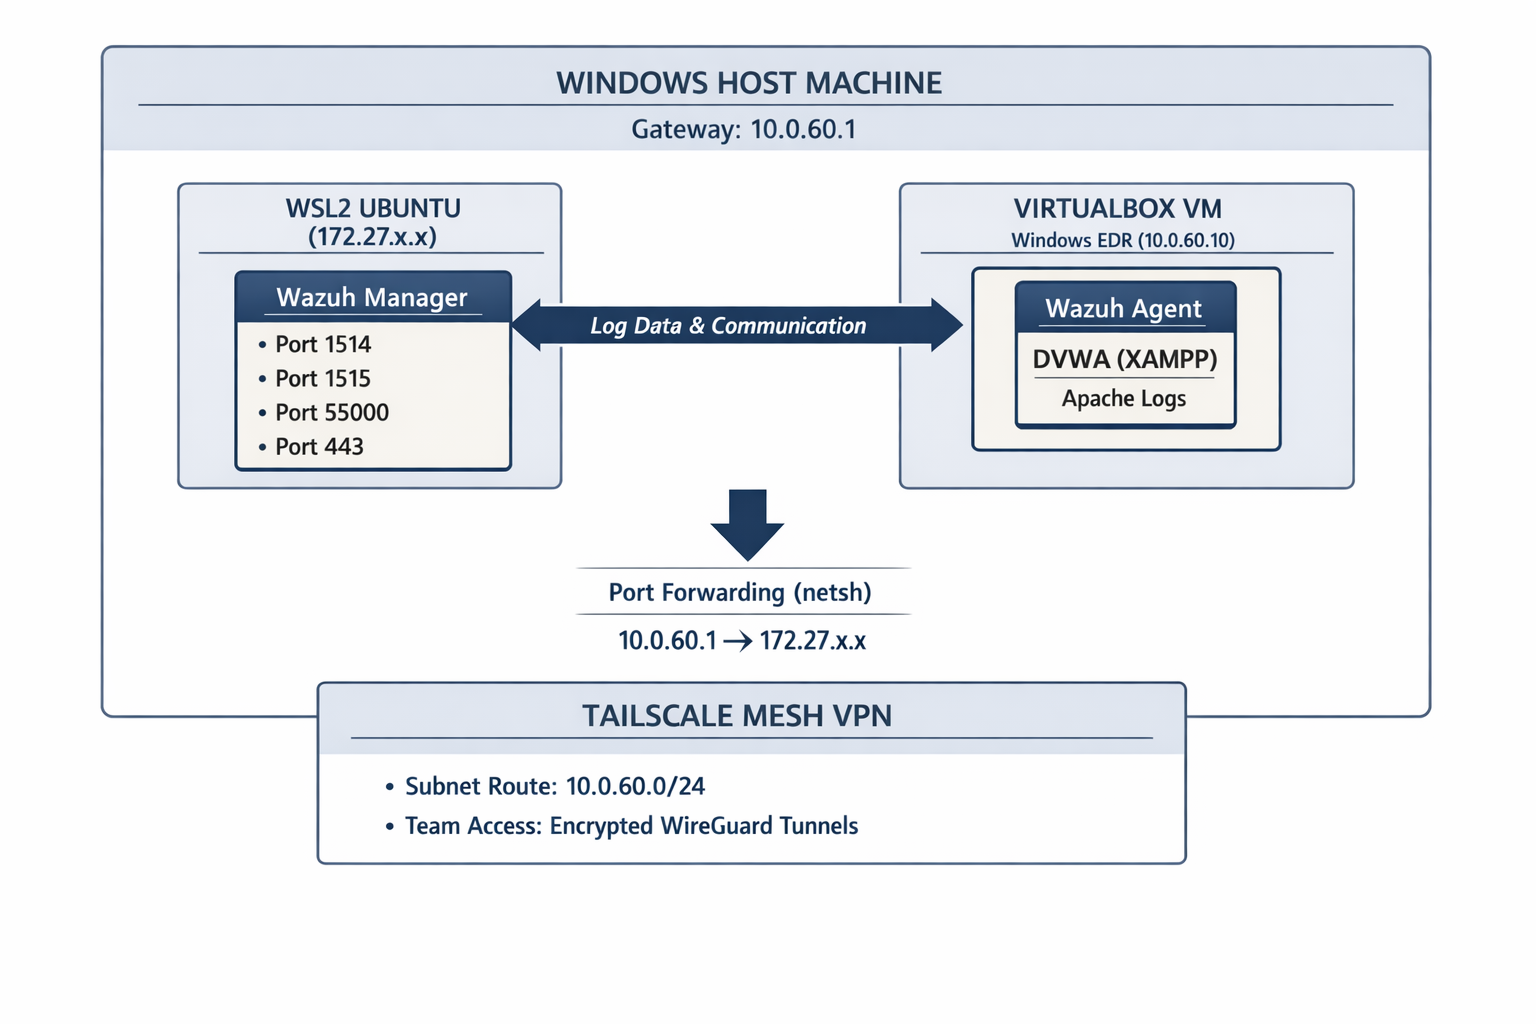
Layer 1 — Infrastructure (This post) VirtualBox provides the isolated network. The Windows host acts as a gateway. WSL2 hosts the Wazuh SIEM. Port forwarding bridges these otherwise disconnected networks.
Layer 2 — Threat Simulation (Team Member 2) A Python APT emulator generates realistic attack traffic targeting DVWA, simulating APT41, Turla, Lazarus, and Sandworm tradecraft.
Layer 3 — AI Analysis (Team Member 3) A Flask application ingests Wazuh alerts via Server-Sent Events, classifies threats using a Random Forest model, enriches with VirusTotal/GeoIP, and presents everything on a live dashboard.
Why This Architecture?
The fundamental challenge I faced was connecting three isolated network environments:
| Network | Subnet | Purpose |
|---|---|---|
| VirtualBox Host-Only | 10.0.60.0/24 | Isolated VM communication |
| WSL2 Virtual Network | 172.27.x.x | Wazuh SIEM hosting |
| Tailscale Mesh | 100.x.x.x | Remote team access |
These networks cannot see each other by default. The entire infrastructure challenge was making them communicate securely and reliably. Every design decision I made flows from this fundamental problem.
Prerequisites
Host Machine Requirements
| Requirement | Minimum | Recommended |
|---|---|---|
| OS | Windows 10 Pro | Windows 11 Pro |
| RAM | 16 GB | 32 GB |
| CPU | 4 cores (VT-x/AMD-V enabled) | 8+ cores |
| Storage | 100 GB free | 200 GB SSD |
| Network | Any | Ethernet preferred |
Security Note: Enable VT-x/AMD-V virtualization in BIOS before proceeding. This is required for VirtualBox to run 64-bit VMs. Access BIOS during boot (usually F2, F10, or DEL key) and enable virtualization technology settings.
Software Requirements
1
2
3
4
5
6
7
8
9
10
11
12
# Download these before starting:
# 1. VirtualBox 7.x
#    https://www.virtualbox.org/wiki/Downloads

# 2. Windows 10/11 ISO (for EDR VM)
#    https://www.microsoft.com/en-us/software-download/windows10

# 3. Tailscale for Windows
#    https://tailscale.com/download/windows

# 4. WSL2 (built into Windows 10/11)
#    Enable via PowerShell - instructions below
Enable WSL2
I opened PowerShell as Administrator and ran:
1
2
3
4
5
6
7
8
9
10
11
12
13
# Enable WSL feature
dism.exe /online /enable-feature /featurename:Microsoft-Windows-Subsystem-Linux /all /norestart

# Enable Virtual Machine Platform
dism.exe /online /enable-feature /featurename:VirtualMachinePlatform /all /norestart

# Set WSL2 as default
wsl --set-default-version 2

# Install Ubuntu (this will be our Wazuh host)
wsl --install -d Ubuntu

# Restart your machine after this
After restart, I opened Ubuntu from the Start Menu and completed the initial setup by creating a username and password.
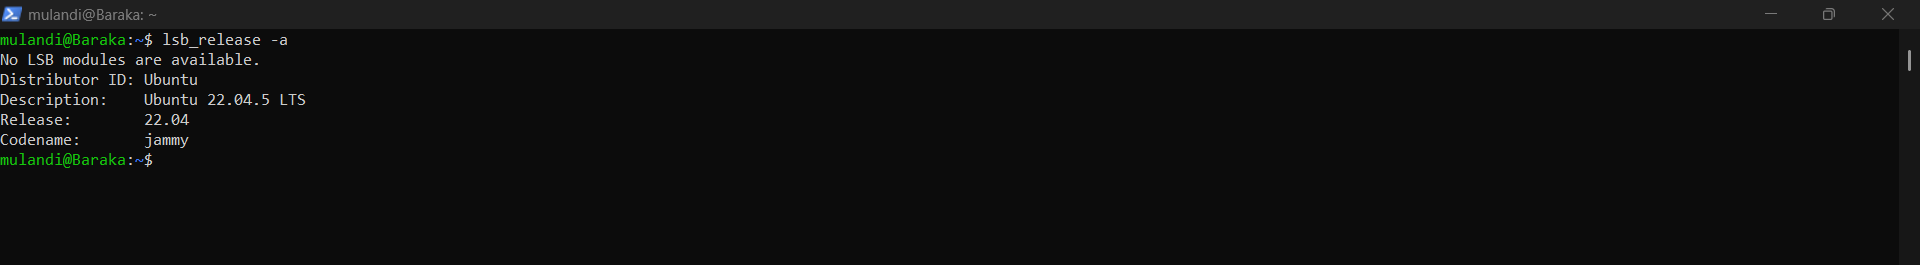 WSL2 Ubuntu terminal showing successful installation with Ubuntu version information
Part 1: VirtualBox Configuration
1.1 Installing VirtualBox
I downloaded VirtualBox from the official site and ran the installer, accepting defaults unless I had specific storage preferences.
Security Implication: VirtualBox installs several virtual network adapters on your host. These are safe but will appear in your network connections. Note them — I configured them shortly after.
1.2 Creating the Windows EDR Virtual Machine
This VM is my attack surface — it runs DVWA and hosts the Wazuh agent.
Step 1: Create New VM
- Open VirtualBox Manager
- Click New (blue icon)
- Configure basic settings:
1
2
3
Name:    Windows-EDR
Type:    Microsoft Windows
Version: Windows 10 (64-bit)
Step 2: Allocate Hardware Resources
1
2
3
RAM:    4096 MB (4 GB minimum)
CPU:    2 cores
Video:  128 MB
Why 4 GB RAM? DVWA with Apache and MySQL running simultaneously, plus the Wazuh agent, can consume 2–3 GB. Leaving headroom prevents OOM issues that would generate false log entries and corrupt testing data.
Step 3: Create Virtual Hard Disk
1
2
Size:   60 GB (dynamically allocated)
Format: VDI (VirtualBox Disk Image)
Step 4: Attach Windows ISO
- Select your new VM → Settings → Storage
- Click the empty CD icon under Controller: IDE
- Click the CD icon on the right → Choose a disk file
- Select your Windows 10 ISO
1.3 Network Configuration
Network configuration in a multi-layer lab requires careful thought.
The Problem
VirtualBox VMs require two distinct types of connectivity:
- Internal communication — for Wazuh agent → manager traffic
- Internet access — for updates, downloads, and external integrations
A single adapter cannot cleanly handle both roles in this architecture, so I used a dual-adapter design.
Adapter 1 — NAT (Internet Access)
- VM Settings → Network → Adapter 1
- Check Enable Network Adapter
- Attached to: NAT Network (or NAT)
- (Optional) Select custom NAT network (e.g.,
10.0.50.0/24)
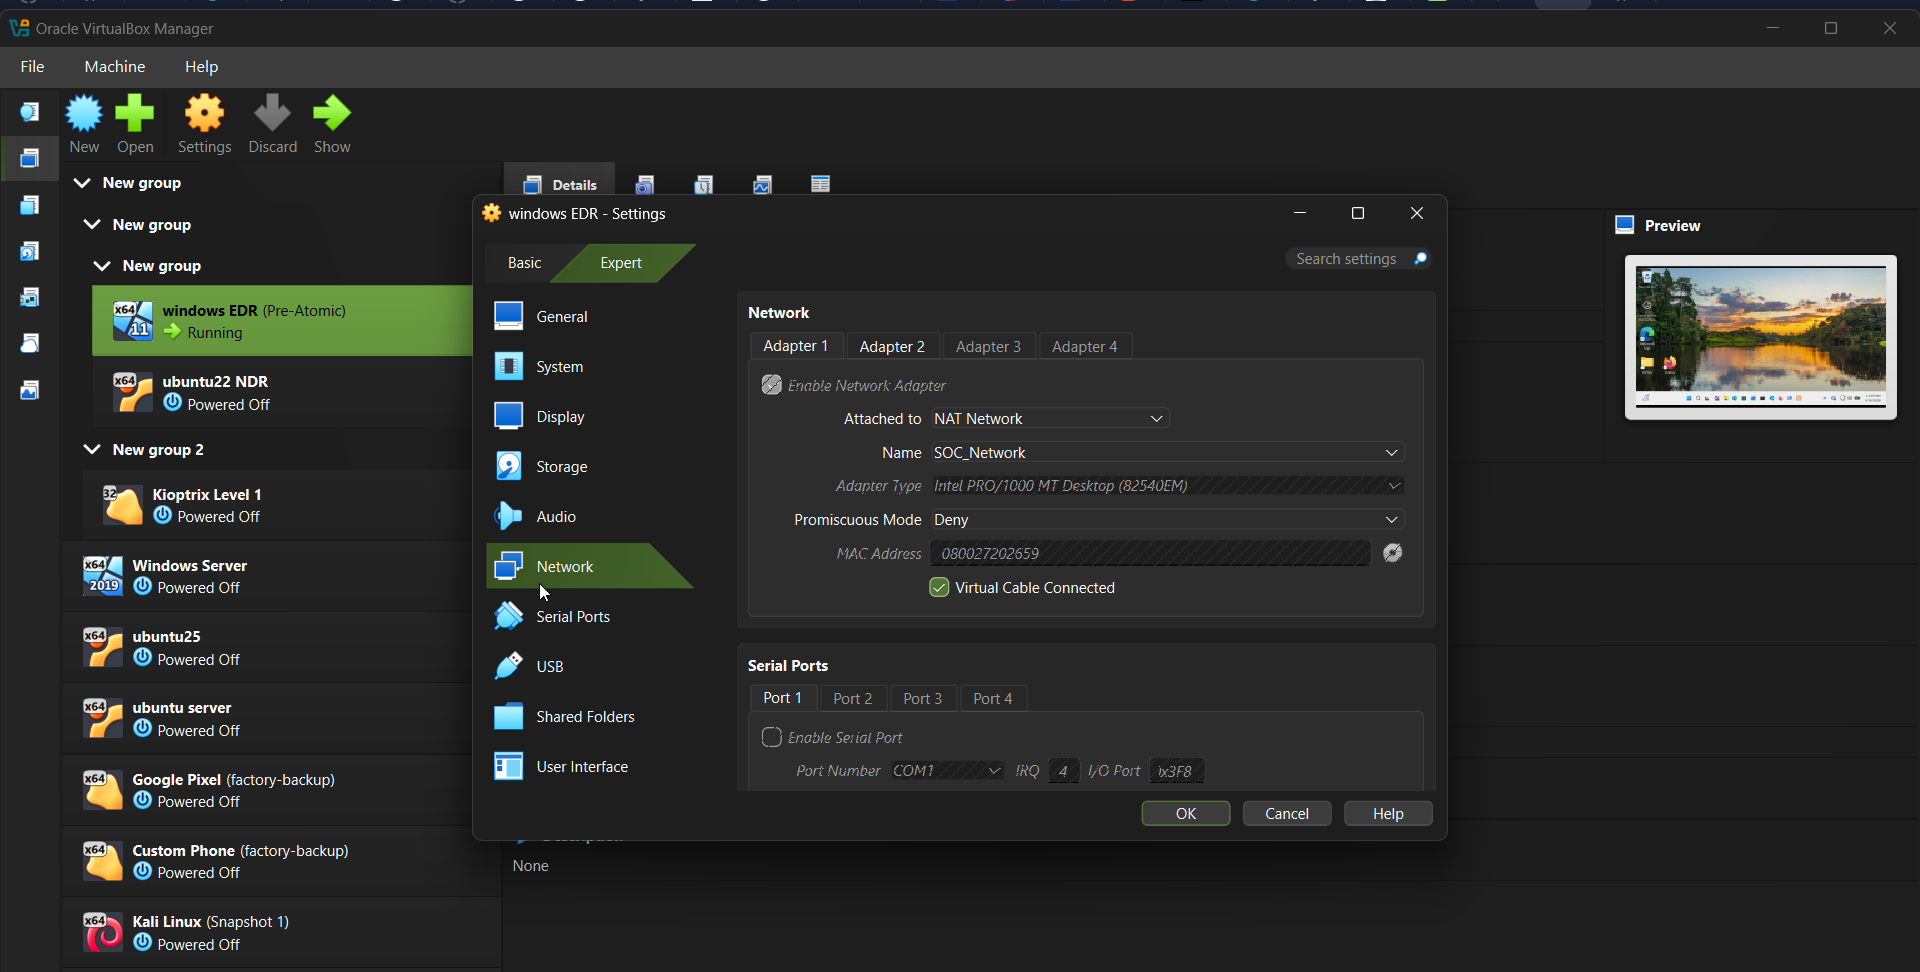 Adapter 1 (NAT) — provides outbound internet connectivity
Adapter 2 — Host-Only (SOC Communication)
- VM Settings → Network → Adapter 2
- Check Enable Network Adapter
- Attached to: Host-only Adapter
- Name: Select the host-only network (configured below)
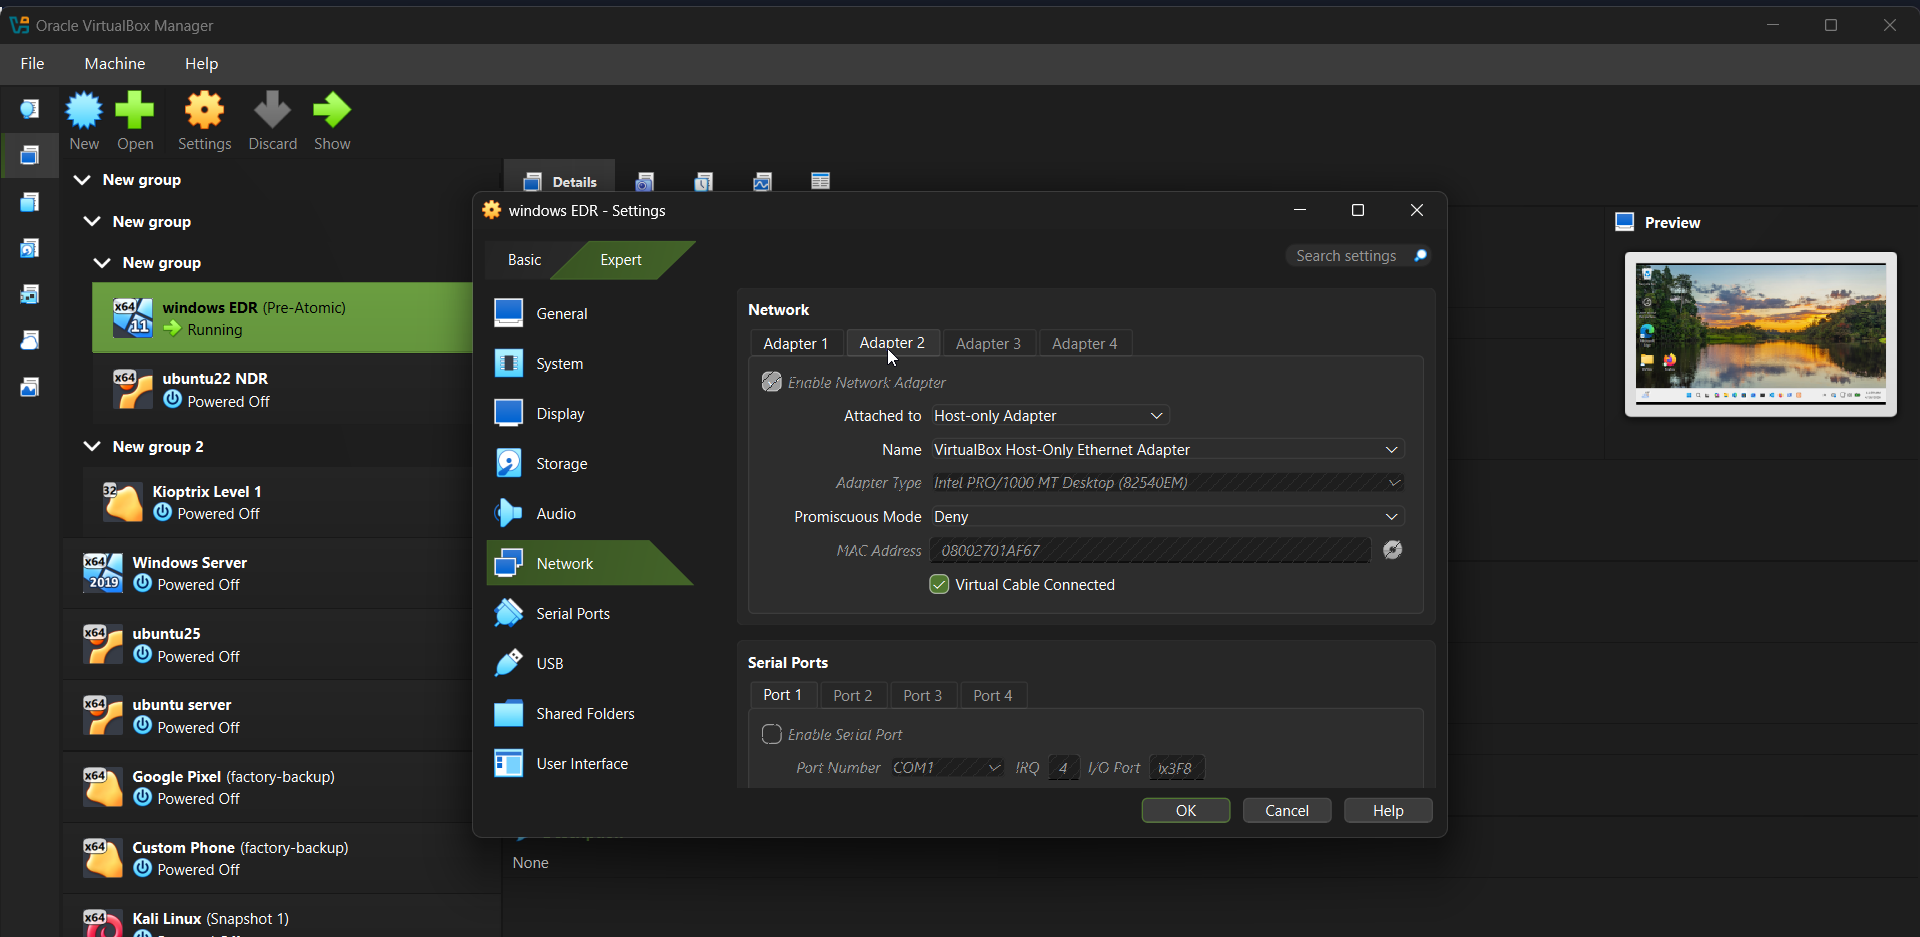 Adapter 2 (Host-only) — isolated SOC communication network
Security Design Note: The dual-adapter approach separates trust zones:
- The NAT adapter allows outbound internet access while blocking unsolicited inbound traffic.
- The host-only adapter enables controlled communication between the VM and the host (Wazuh manager).
This mirrors real-world network segmentation and reduces unintended exposure.
Why Use a NAT Network?
I used a NAT network (e.g., 10.0.50.0/24) instead of default NAT for the following reasons:
- Controlled outbound access: Allows updates and downloads without exposing the VM externally
- Predictable addressing: Custom subnet simplifies debugging and documentation
- Scalability: Multiple VMs can share the same outbound network
- Segmentation: Keeps internet traffic separate from SOC monitoring traffic
It is optional to use a custom NAT.
Important: The NAT network is not part of the detection pipeline — it exists purely for external connectivity.
1.4 Creating the Host-Only Network
In VirtualBox:
- File → Tools → Network Manager
- Select Host-only Networks
- Click Create
- Configure:
1
2
3
IPv4 Address: 10.0.60.1
Subnet Mask:  255.255.255.0
DHCP:         Disabled
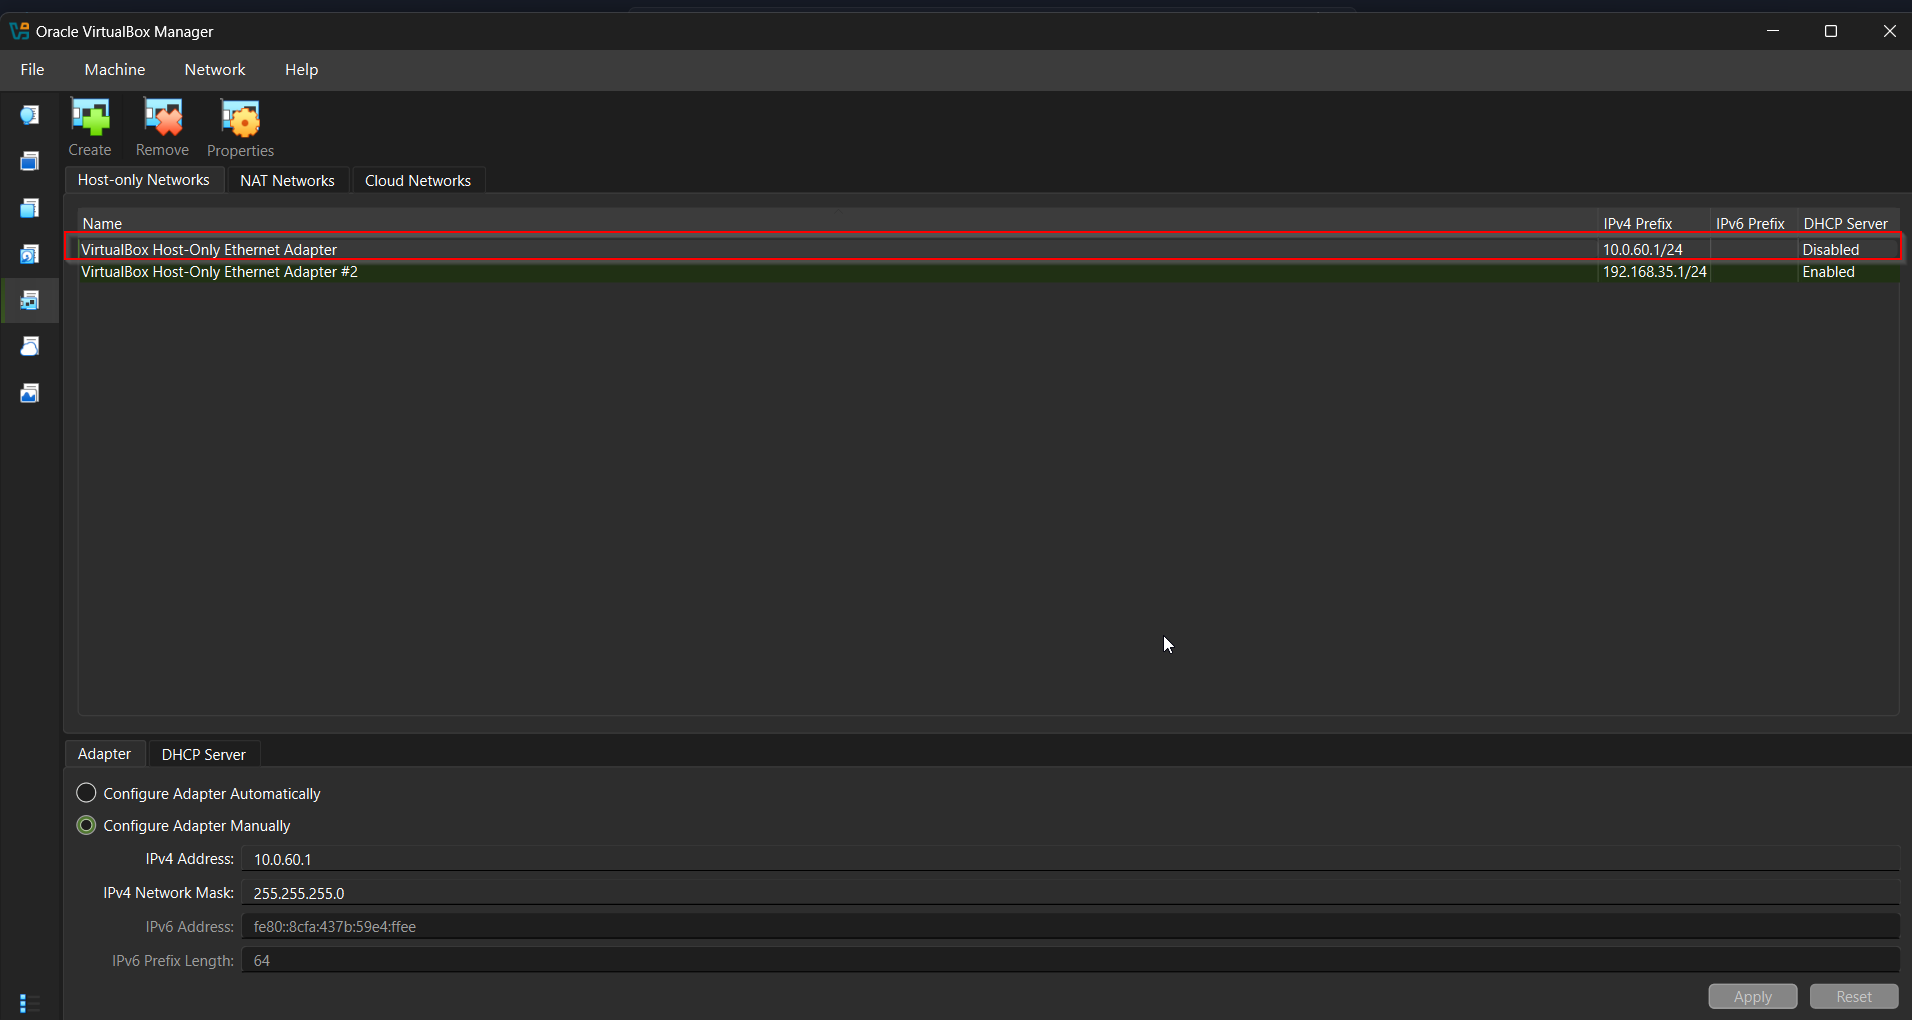
Why Disable DHCP? Static addressing ensures consistent communication paths. Dynamic IP changes would break port forwarding and agent connections.
1.5 Configuring Static IP in Windows VM
After Windows was installed:
- Open Network Connections
- Select the Host-only adapter
- Configure IPv4:
1
2
3
4
IP Address:       10.0.60.10
Subnet Mask:      255.255.255.0
Default Gateway:  (leave blank)
DNS:              (leave blank)
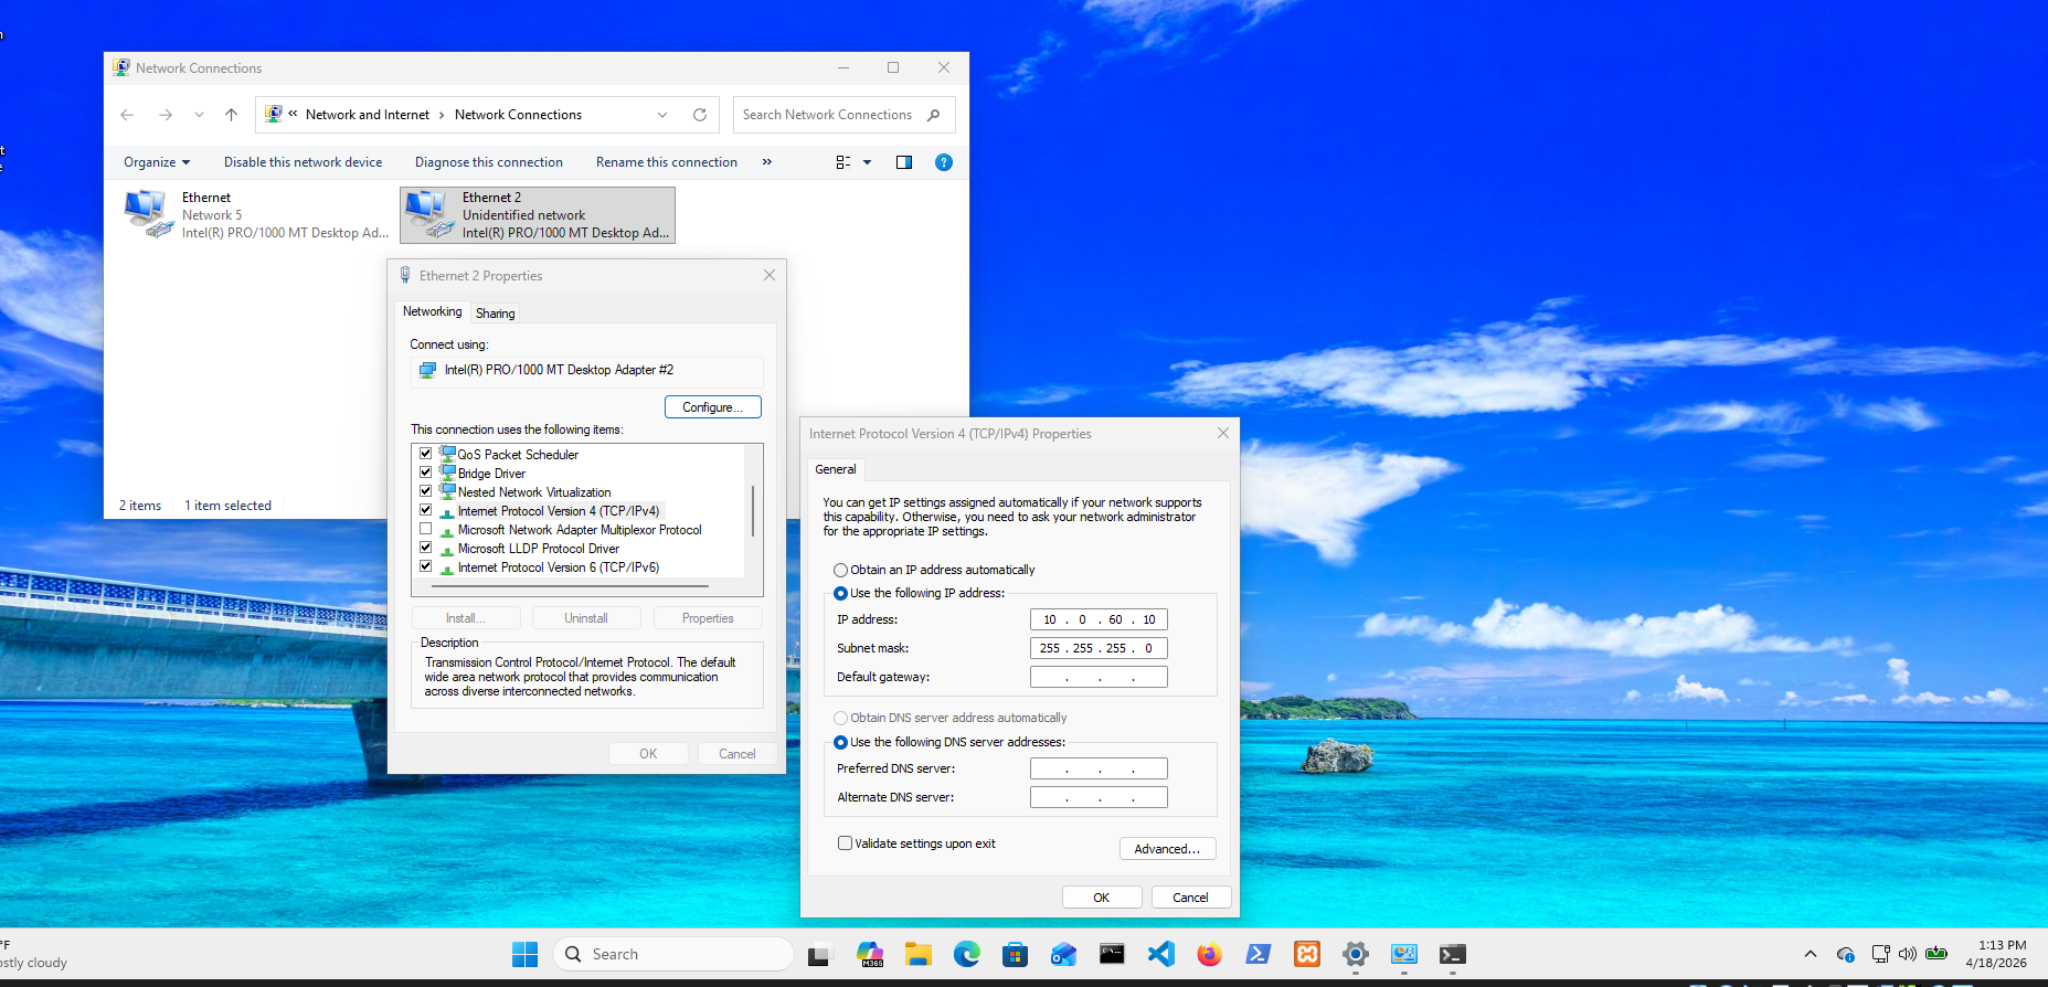 Static IP configuration
Why no gateway? The host-only network is used exclusively for internal SOC communication. Internet-bound traffic is handled by the NAT adapter, which already has a default gateway.
In multi-homed systems, only one interface should define a default gateway to avoid routing conflicts.
Verification
1
ipconfig /all
Expected output:
- NAT adapter →
10.0.50.xwith gateway - Host-only adapter →
10.0.60.10with no gateway
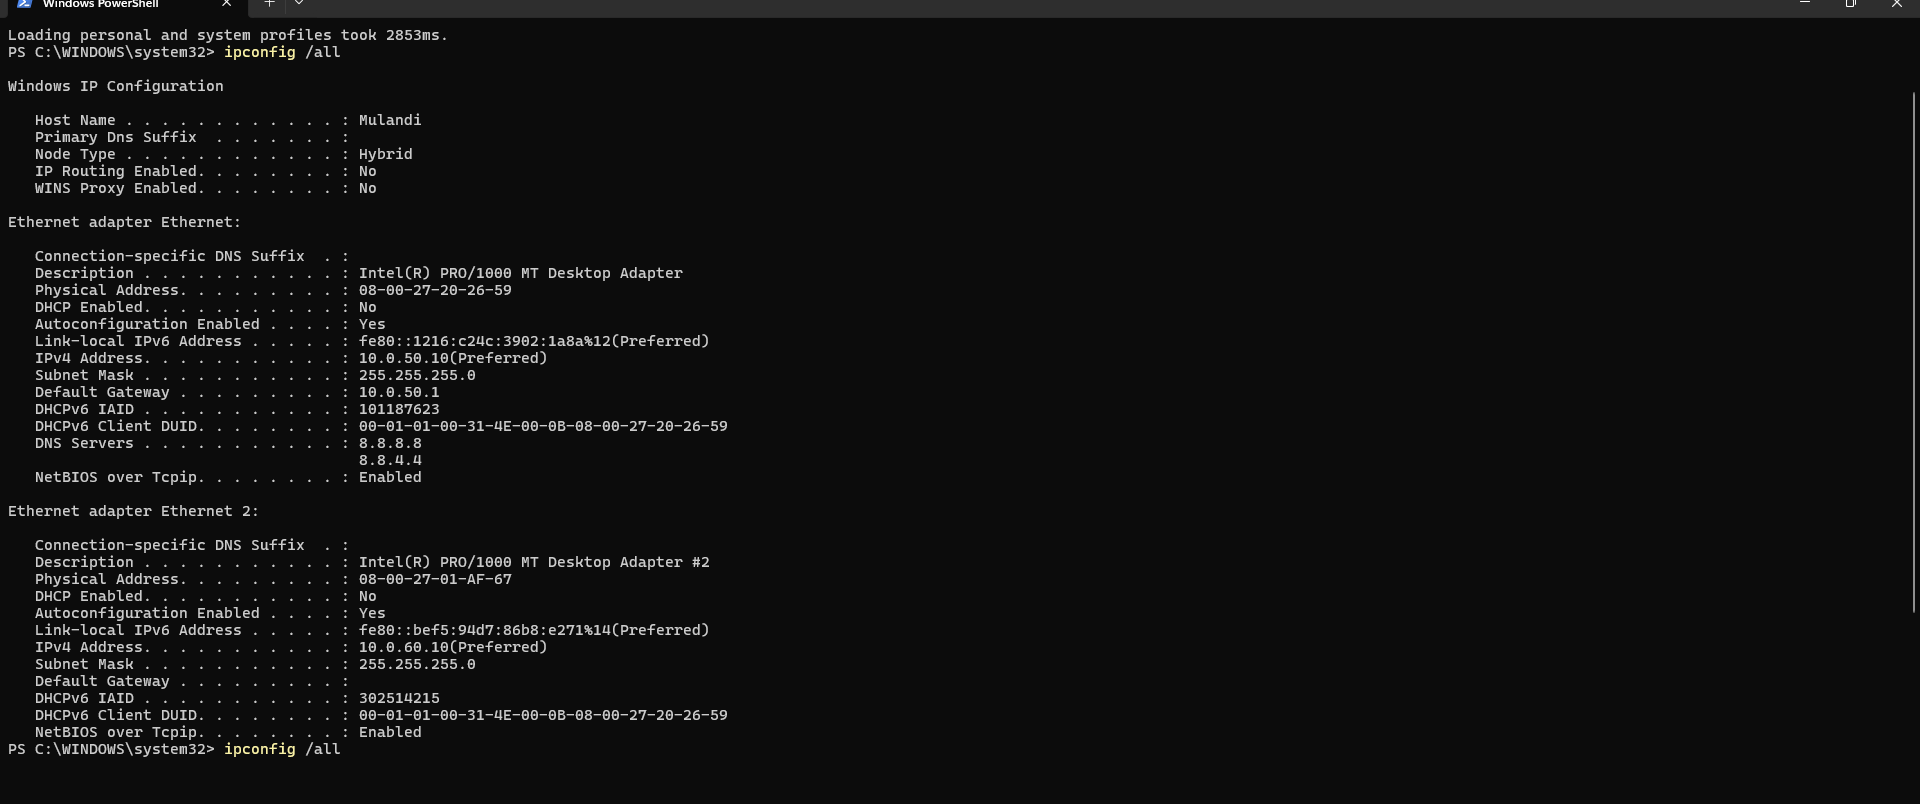 Network configuration
Set Network Profile to Private
1
Get-NetConnectionProfile | Set-NetConnectionProfile -NetworkCategory Private
Why Private? The Windows firewall applies stricter rules on Public networks, blocking inbound connections. Setting the profile to Private allows trusted internal communication (required for Wazuh agent connectivity).
Part 2: Firewall Configuration
2.1 Understanding the Firewall Layers
My lab has three firewall boundaries:
1
2
3
4
5
[Internet] → [Windows Host Firewall] → [VM Network]
                                              ↓
                                    [Windows VM Firewall]
                                              ↓
                                    [WSL2 (no firewall by default)]
Each layer needs specific rules. Missing one layer breaks the entire pipeline.
2.2 Windows VM Firewall Rules
I ran all commands as Administrator in Windows VM PowerShell:
Rule 1: Allow ICMP (Ping)
1
2
3
4
5
6
7
8
New-NetFirewallRule `
  -DisplayName "Allow ICMPv4 - Lab" `
  -Protocol ICMPv4 `
  -IcmpType 8 `
  -Enabled True `
  -Profile Any `
  -Direction Inbound `
  -Action Allow
Purpose: ICMP is disabled by default in Windows. Without this rule, you cannot ping the VM to verify connectivity — your first line of troubleshooting becomes impossible.
Security Implication: Enabling ICMP exposes the host to ping sweeps and ICMP-based reconnaissance. In production, restrict this to specific source IPs (e.g., only from 10.0.60.1).
Rule 2: Allow All Traffic from Internal Network
1
2
3
4
5
6
7
New-NetFirewallRule `
  -DisplayName "Allow Internal Network 10.0.60.0/24" `
  -Direction Inbound `
  -RemoteAddress 10.0.60.0/24 `
  -Action Allow `
  -Profile Any `
  -Enabled True
Purpose: Allows the Windows host (10.0.60.1) and any other VMs on the subnet to communicate with this machine. This includes Wazuh agent enrollment traffic and RDP access.
Security Implication: This rule is broad — it allows all protocols from the entire /24 subnet. In production, restrict to specific ports (3389 for RDP, 1514/1515 for Wazuh). I used the broad rule here for lab simplicity.
Rule 3: Allow Tailscale Network
1
2
3
4
5
6
7
New-NetFirewallRule `
  -DisplayName "Allow Tailscale Network" `
  -Direction Inbound `
  -RemoteAddress 100.0.0.0/8 `
  -Action Allow `
  -Profile Any `
  -Enabled True
Purpose: Tailscale assigns IPs in the 100.64.0.0/10 range. This rule allows team members to connect via Tailscale without their traffic being blocked by the VM firewall.
Rule 4: Enable Remote Desktop
1
2
3
4
5
6
7
8
# Enable RDP in registry
Set-ItemProperty `
  -Path 'HKLM:\System\CurrentControlSet\Control\Terminal Server' `
  -Name "fDenyTSConnections" `
  -Value 0

# Enable RDP firewall rule group
Enable-NetFirewallRule -DisplayGroup "Remote Desktop"
Purpose: Allows remote management of the Windows VM from the host machine and team members via Tailscale.
Security Implication: RDP on default port 3389 is a significant attack surface. In production: change to a non-standard port, restrict source IPs, enforce Network Level Authentication (NLA), and require MFA.
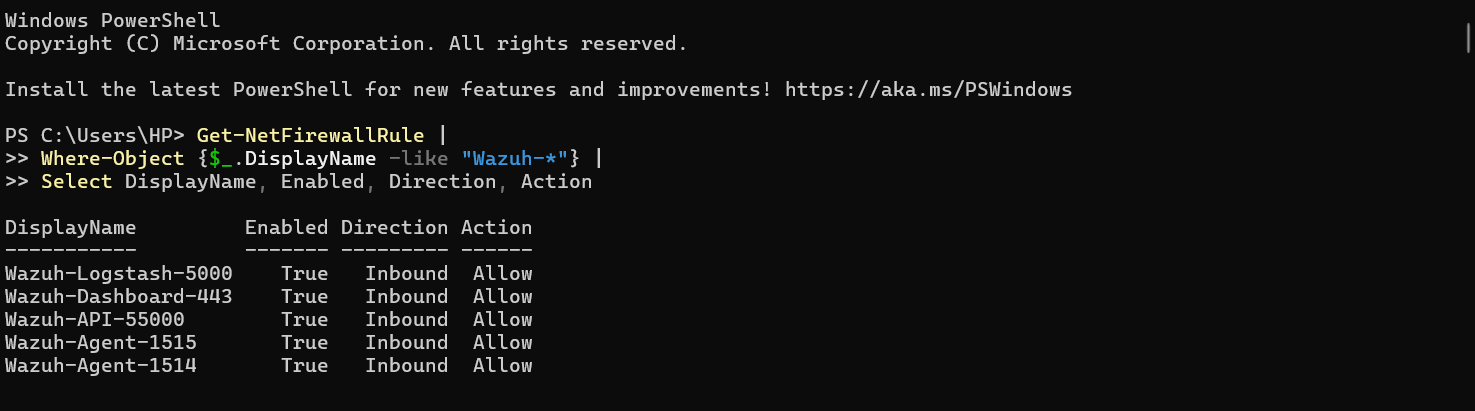
Verify all rules are in place:
1
2
3
4
Get-NetFirewallRule |
  Where-Object {$_.DisplayName -like "*Allow*" -and $_.Enabled -eq "True"} |
  Select-Object DisplayName, Direction, Action |
  Format-Table -AutoSize
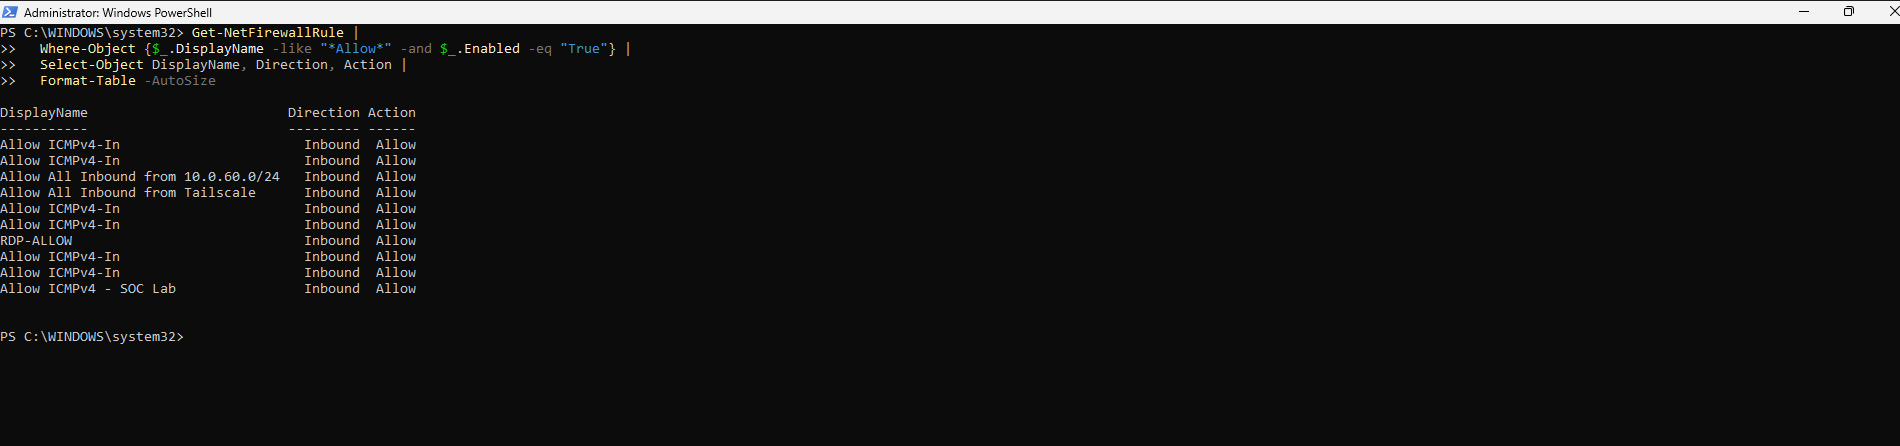 Windows VM firewall rules
2.3 Windows Host Firewall Rules (for Port Forwarding)
On the Windows host machine (not the VM), I created rules to allow Wazuh traffic to reach the port forwarding service:
1
2
3
4
5
6
7
8
9
10
11
12
13
14
15
16
17
18
19
20
21
22
23
24
25
26
27
28
29
30
31
32
33
34
35
# Allow Wazuh agent log transmission
New-NetFirewallRule `
  -DisplayName "Wazuh-Agent-1514" `
  -Direction Inbound `
  -LocalPort 1514 `
  -Protocol TCP `
  -Action Allow `
  -Enabled True

# Allow Wazuh agent enrollment
New-NetFirewallRule `
  -DisplayName "Wazuh-Enrollment-1515" `
  -Direction Inbound `
  -LocalPort 1515 `
  -Protocol TCP `
  -Action Allow `
  -Enabled True

# Allow Wazuh API
New-NetFirewallRule `
  -DisplayName "Wazuh-API-55000" `
  -Direction Inbound `
  -LocalPort 55000 `
  -Protocol TCP `
  -Action Allow `
  -Enabled True

# Allow Wazuh Dashboard
New-NetFirewallRule `
  -DisplayName "Wazuh-Dashboard-443" `
  -Direction Inbound `
  -LocalPort 443 `
  -Protocol TCP `
  -Action Allow `
  -Enabled True
 Windows Defender Firewall with Advanced Security showing the four Wazuh inbound rules
2.4 Firewall Verification
1
2
3
4
5
6
7
8
# On Windows Host - test each critical port
$ports = @(1514, 1515, 55000, 443, 3389)

foreach ($port in $ports) {
    $result = Test-NetConnection -ComputerName 10.0.60.1 -Port $port -WarningAction SilentlyContinue
    $status = if ($result.TcpTestSucceeded) { "✓ OPEN" } else { "✗ CLOSED" }
    Write-Host "Port $port : $status"
}
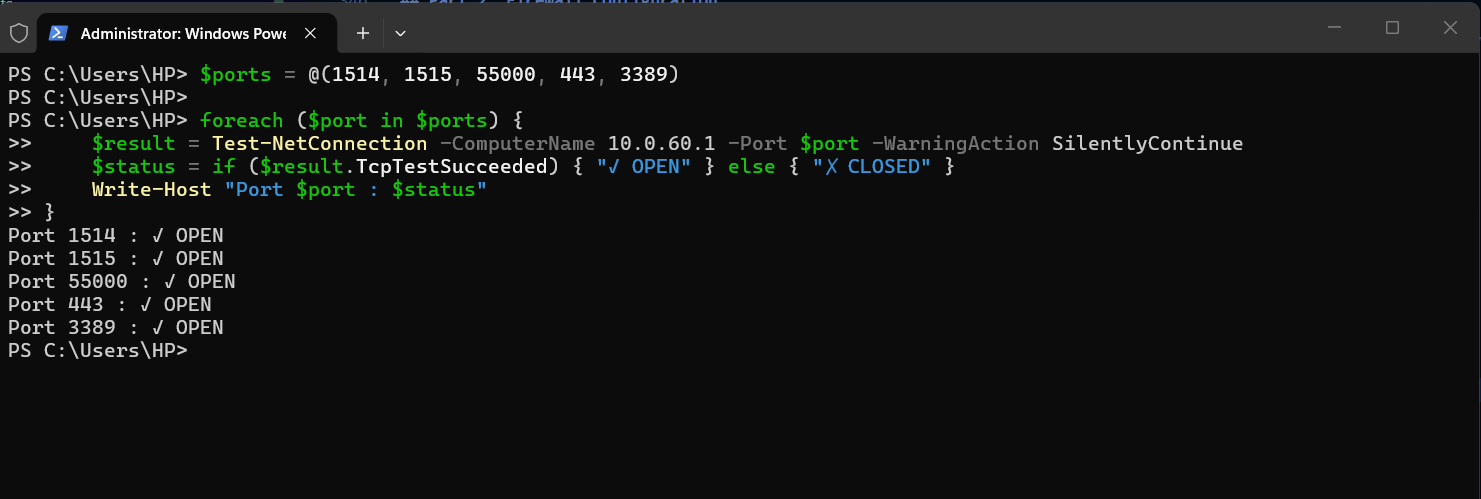 PowerShell output showing port status for all critical ports
Troubleshooting: If a port shows CLOSED despite creating the rule, check the network profile. Rules scoped to “Private” profile won’t apply to “Public” networks. Run
Get-NetConnectionProfileand ensure the relevant adapter shows “Private”.
Part 3: Port Forwarding — The Bridge Between Networks
3.1 Understanding the Problem
This is the most technically interesting part of the entire build.
The Challenge:
1
2
3
4
5
6
7
8
Windows VM Agent wants to connect to Wazuh at:
→ 10.0.60.1:1514 (the gateway IP it can reach)

But Wazuh is actually running at:
→ 172.27.62.x:1514 (inside WSL2, which the VM cannot reach)

Solution: Make Windows HOST intercept traffic at 10.0.60.1:1514
and forward it to the actual WSL2 IP.
WSL2 creates a virtual network interface (172.x.x.x subnet) that is separate from the VirtualBox network. There is no direct route between 10.0.60.0/24 and 172.x.x.x. The Windows host is the only machine that can reach both.
3.2 Getting the WSL2 IP
1
2
# On Windows Host
wsl hostname -I
This returned something like 172.27.62.12. I took note of this.
The Critical Problem: WSL2 is assigned a new IP every time Windows restarts. This means your port forwarding rules break on every reboot. I solved this with an automation script in Section 3.4.
3.3 Setting Up Port Forwarding
1
2
3
4
5
6
7
8
9
10
11
12
13
14
15
16
17
18
19
20
21
22
23
24
25
26
27
28
29
30
31
32
# Run as Administrator on Windows Host
# Replace 172.27.62.12 with your actual WSL2 IP

$WSL_IP = "172.27.62.12"

# Wazuh agent log transmission
netsh interface portproxy add v4tov4 `
  listenaddress=10.0.60.1 `
  listenport=1514 `
  connectaddress=$WSL_IP `
  connectport=1514

# Wazuh agent enrollment
netsh interface portproxy add v4tov4 `
  listenaddress=10.0.60.1 `
  listenport=1515 `
  connectaddress=$WSL_IP `
  connectport=1515

# Wazuh API
netsh interface portproxy add v4tov4 `
  listenaddress=10.0.60.1 `
  listenport=55000 `
  connectaddress=$WSL_IP `
  connectport=55000

# Wazuh Dashboard
netsh interface portproxy add v4tov4 `
  listenaddress=10.0.60.1 `
  listenport=443 `
  connectaddress=$WSL_IP `
  connectport=443
Verify the rules were created:
1
netsh interface portproxy show all
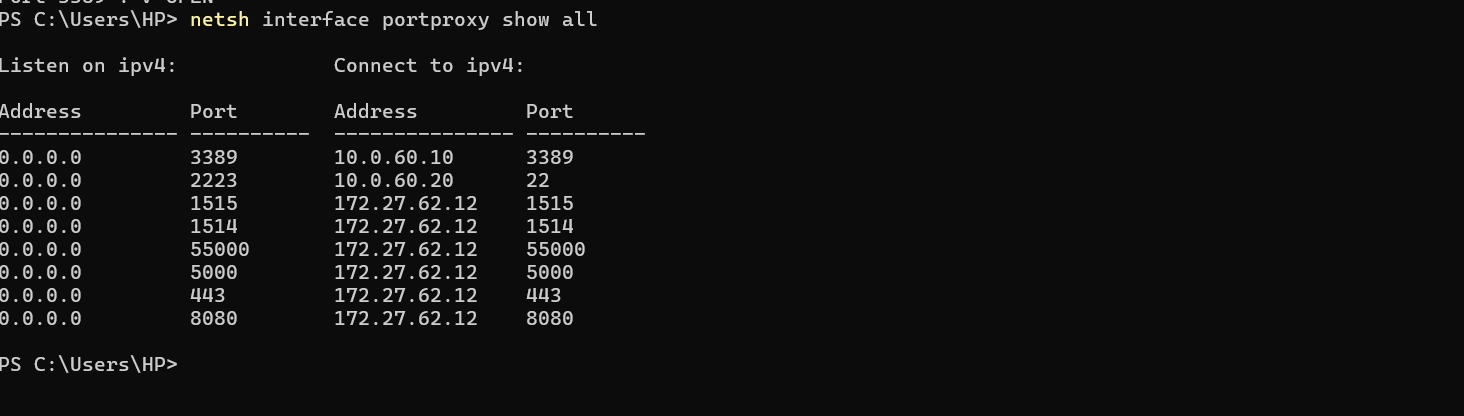
netsh interface portproxy show all output showing all four forwarding rules with listen addresses and connect addresses
3.4 Solving the Reboot Problem — Auto-Update Script
I created a PowerShell script that runs at Windows startup to automatically detect the current WSL2 IP and update port forwarding rules:
1
2
3
4
5
6
7
8
9
10
11
12
13
14
15
16
17
18
19
20
21
22
23
24
25
26
27
28
29
# Save as: C:\Scripts\Update-WazuhForwarding.ps1

# Get current WSL2 IP dynamically
$WSL_IP = (wsl hostname -I).Trim().Split()[0]

Write-Host "WSL2 IP detected: $WSL_IP" -ForegroundColor Cyan

# Remove existing port forwarding rules
$ports = @(1514, 1515, 55000, 443)

foreach ($port in $ports) {
    netsh interface portproxy delete v4tov4 `
      listenport=$port `
      listenaddress=10.0.60.1 2>$null
}

# Recreate with current WSL2 IP
foreach ($port in $ports) {
    netsh interface portproxy add v4tov4 `
      listenaddress=10.0.60.1 `
      listenport=$port `
      connectaddress=$WSL_IP `
      connectport=$port

    Write-Host "Forwarded 10.0.60.1:$port → ${WSL_IP}:$port" -ForegroundColor Green
}

Write-Host "`nPort forwarding updated successfully!" -ForegroundColor Green
netsh interface portproxy show all
I then scheduled it to run at Windows startup:
1
2
3
4
5
6
7
8
9
10
11
12
13
14
15
16
17
18
# Create scheduled task (run as Administrator)
$action = New-ScheduledTaskAction `
  -Execute "PowerShell.exe" `
  -Argument "-NonInteractive -File C:\Scripts\Update-WazuhForwarding.ps1"

$trigger = New-ScheduledTaskTrigger -AtStartup

$principal = New-ScheduledTaskPrincipal `
  -UserId "SYSTEM" `
  -LogonType ServiceAccount `
  -RunLevel Highest

Register-ScheduledTask `
  -TaskName "Update-Wazuh-Port-Forwarding" `
  -Action $action `
  -Trigger $trigger `
  -Principal $principal `
  -Description "Updates WSL2 port forwarding for Wazuh after reboot"
Why This Matters: Without this script, the entire detection pipeline silently breaks every time Windows restarts. Agents appear connected but stop sending logs. This script is the difference between a lab that works reliably and one that mystifies you with intermittent failures.
3.5 Testing Port Forwarding
1
2
3
4
5
6
7
8
9
10
11
12
13
14
15
16
17
# From Windows Host — test each forwarded port
$testPorts = @(
    @{Port=1514; Name="Wazuh Agent"},
    @{Port=1515; Name="Wazuh Enrollment"},
    @{Port=55000; Name="Wazuh API"},
    @{Port=443; Name="Wazuh Dashboard"}
)

foreach ($test in $testPorts) {
    $result = Test-NetConnection `
      -ComputerName 10.0.60.1 `
      -Port $test.Port `
      -WarningAction SilentlyContinue

    $status = if ($result.TcpTestSucceeded) { "✓" } else { "✗" }
    Write-Host "$status $($test.Name) (Port $($test.Port))"
}
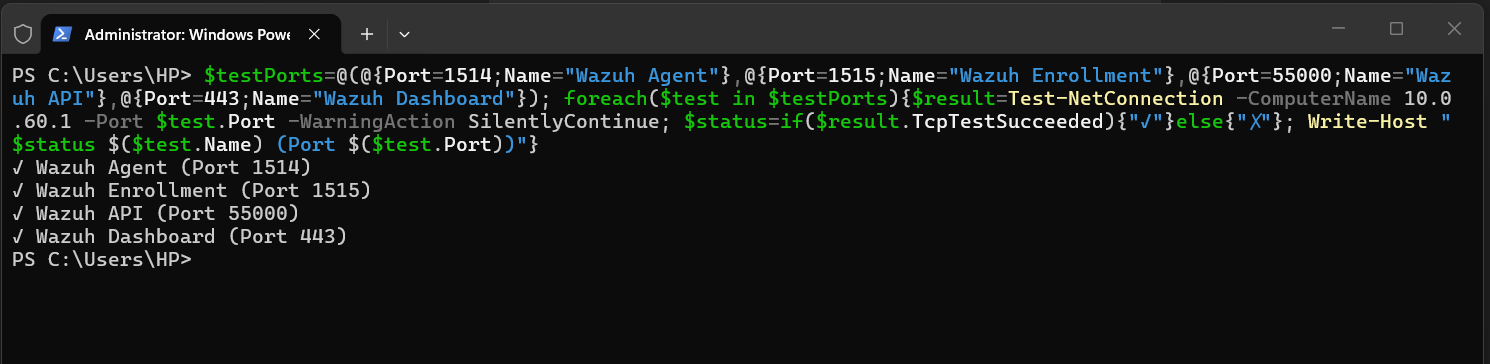 Port forwarding test
Part 4: Tailscale — Zero-Trust Remote Access
4.1 Why Tailscale Over Traditional VPN
Traditional VPN solutions require:
- A publicly accessible server
- Port forwarding on your router
- Complex PKI certificate management
- Manual client configuration
Tailscale uses WireGuard under the hood with a coordination server that handles key exchange. The result: encrypted peer-to-peer connections with no exposed ports on your router, no complex configuration, and cross-platform support.
In our lab context, Tailscale solved a specific problem: how do three team members on different networks collaborate on a lab that lives on one person’s machine?
4.2 Installing Tailscale on Windows Host
- Download from: https://tailscale.com/download/windows
- Run the installer
- Click Log in in the system tray icon
- Authenticate with your preferred identity provider (Google, Microsoft, or GitHub)
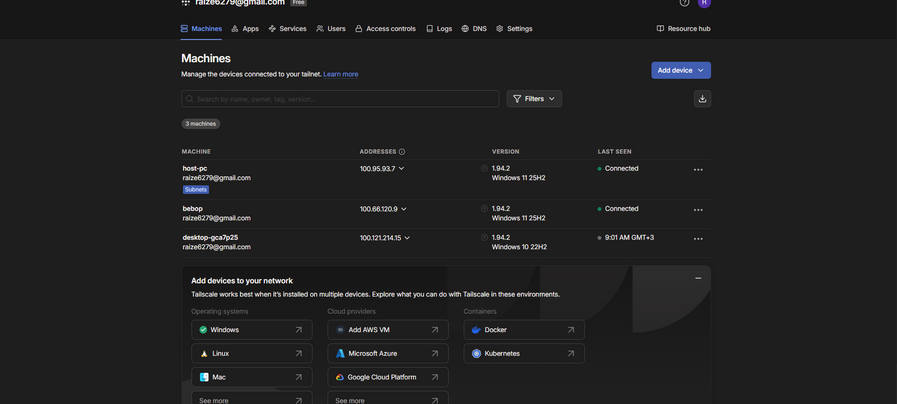 Tailscale connections
4.3 Enabling Subnet Routing
This is the key configuration that makes the entire lab accessible to the team without installing Tailscale on every VM:
1
2
3
4
5
6
7
8
# Stop Tailscale
tailscale down

# Restart with subnet routing
tailscale up --advertise-routes=10.0.60.0/24 --accept-routes

# Verify
tailscale status
What this does: My Windows host tells the Tailscale network “I can route traffic to 10.0.60.0/24.” Any Tailscale peer that accepts routes can then reach 10.0.60.10 (the Windows VM) as if they were on the local network.
4.4 Approving the Route in Admin Console
Subnet routes require explicit approval to prevent accidental network exposure:
- Go to: https://login.tailscale.com/admin/machines
- Find your Windows host machine
- Click ⋮ → Edit route settings
- Enable checkbox for 10.0.60.0/24
- Click Save
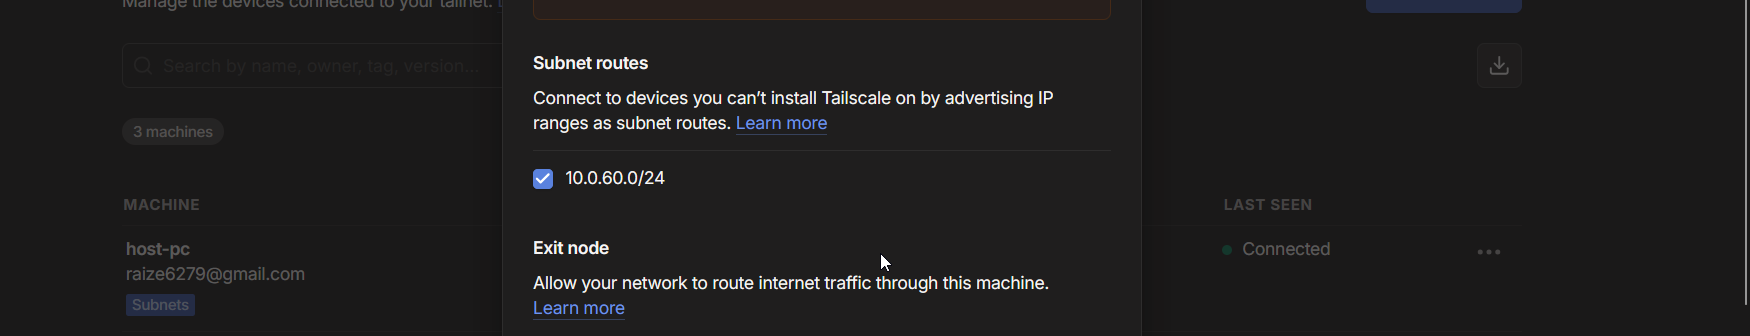 Tailscale subnet routing
4.5 Team Member Setup
Each team member installed Tailscale and ran:
1
2
3
4
5
# Windows
tailscale up --accept-routes

# Linux/Mac
sudo tailscale up --accept-routes
Verification:
1
2
3
# Team member verifies they can reach the lab
ping 10.0.60.10
Test-NetConnection -ComputerName 10.0.60.10 -Port 3389
Security Note: Tailscale implements a zero-trust model — every device must authenticate before joining the network, and every connection is end-to-end encrypted with WireGuard. This is significantly more secure than leaving RDP ports exposed to the internet.
4.6 Tailscale IP Forwarding (Required for Subnet Routing)
1
2
3
4
5
6
7
# Enable IP forwarding on Windows host
Set-NetIPInterface -Forwarding Enabled

# Verify
Get-NetIPInterface |
  Where-Object {$_.Forwarding -eq "Enabled"} |
  Select-Object InterfaceAlias, Forwarding
 Tailscale IP forwarding enabled
Part 5: Wazuh — The SIEM Core
5.1 Understanding Wazuh Architecture
Wazuh has three main components:
1
2
3
Wazuh Manager    → Receives and analyzes log data from agents
Wazuh Indexer    → OpenSearch-based storage and indexing engine
Wazuh Dashboard  → Web UI built on OpenSearch Dashboards
All three run on my WSL2 Ubuntu instance. Agents run on monitored endpoints (the Windows VM).
5.2 Installing Wazuh Manager on WSL2
I opened Ubuntu in WSL2 and ran all commands with sudo:
Step 1: System Preparation
1
2
3
4
5
# Update package lists
sudo apt-get update && sudo apt-get upgrade -y

# Install required packages
sudo apt-get install -y curl apt-transport-https gnupg
Step 2: Add Wazuh Repository
1
2
3
4
5
6
7
8
9
10
11
12
13
14
# Import Wazuh GPG key
curl -s https://packages.wazuh.com/key/GPG-KEY-WAZUH | \
  gpg --no-default-keyring \
  --keyring gnupg-ring:/usr/share/keyrings/wazuh.gpg \
  --import && \
  chmod 644 /usr/share/keyrings/wazuh.gpg

# Add repository
echo "deb [signed-by=/usr/share/keyrings/wazuh.gpg] \
  https://packages.wazuh.com/4.x/apt/ stable main" | \
  sudo tee -a /etc/apt/sources.list.d/wazuh.list

# Update with new repo
sudo apt-get update
Step 3: Install All-in-One (Manager + Indexer + Dashboard)
1
2
3
4
5
# Download installation assistant
curl -sO https://packages.wazuh.com/4.10/wazuh-install.sh
curl -sO https://packages.wazuh.com/4.10/config.yml

sudo bash ./wazuh-install.sh -a
Important: The installation script outputs credentials at the end. Copy and save these immediately. They include the admin password for the Wazuh dashboard and are shown only once.
Step 4: Verify All Services Are Running
1
2
3
sudo systemctl status wazuh-manager
sudo systemctl status wazuh-indexer
sudo systemctl status wazuh-dashboard
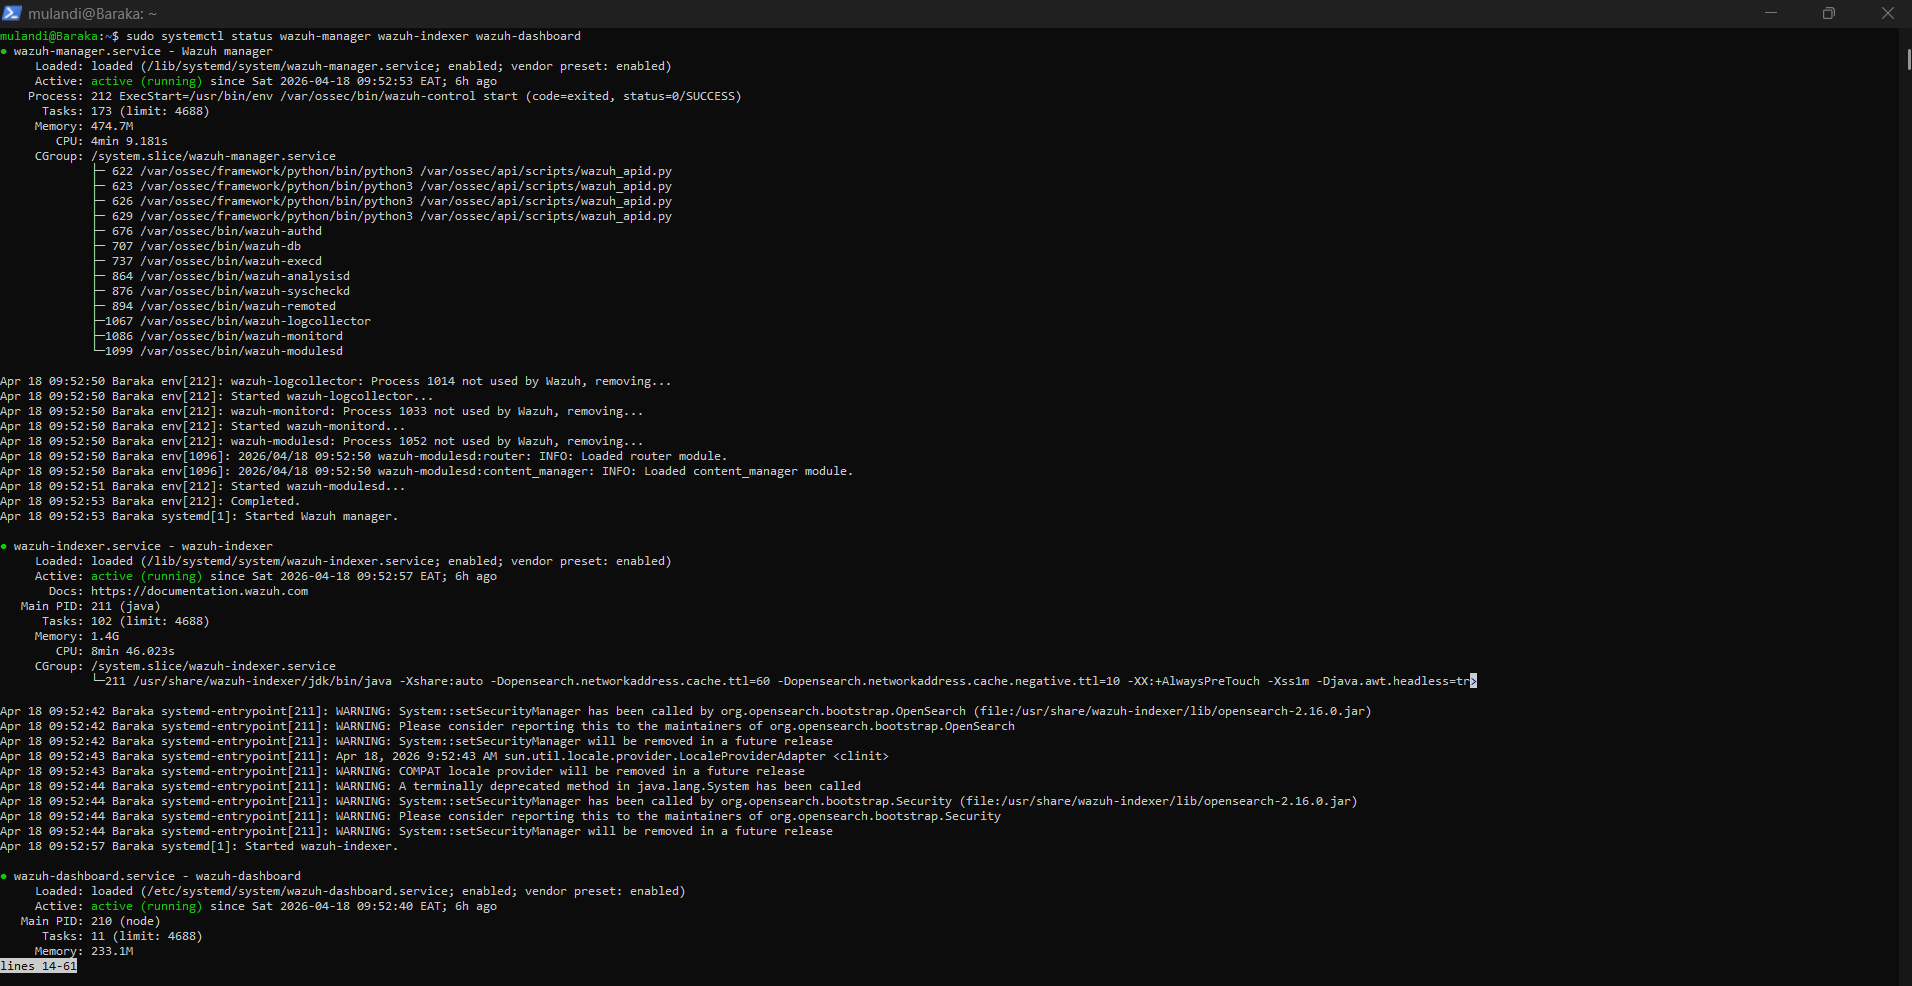
systemctl status output for all three Wazuh services showing “active (running)” in green
Step 5: Verify Ports Are Listening
1
sudo ss -tlnp | grep -E "1514|1515|55000|443|9200"
Expected output:
1
2
3
4
5
tcp   LISTEN  0.0.0.0:1514   (wazuh-remoted)
tcp   LISTEN  0.0.0.0:1515   (wazuh-authd)
tcp   LISTEN  0.0.0.0:55000  (python3/Wazuh API)
tcp   LISTEN  0.0.0.0:443    (node/Dashboard)
tcp   LISTEN  *:9200         (java/Indexer)
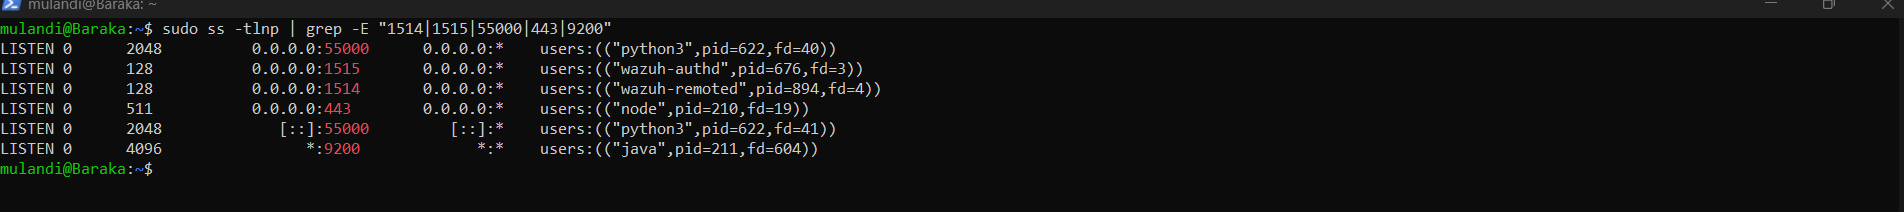
ss -tlnp output showing all Wazuh ports in LISTEN state
5.3 Wazuh Dashboard Setup
Accessing the Dashboard:
I opened my browser and navigated to:
1
https://10.0.60.1
I accepted the self-signed certificate warning (expected in lab environments) and logged in with:
- Username: admin
- Password: (from installation output)
 Wazuh dashboard login page at https://10.0.60.1
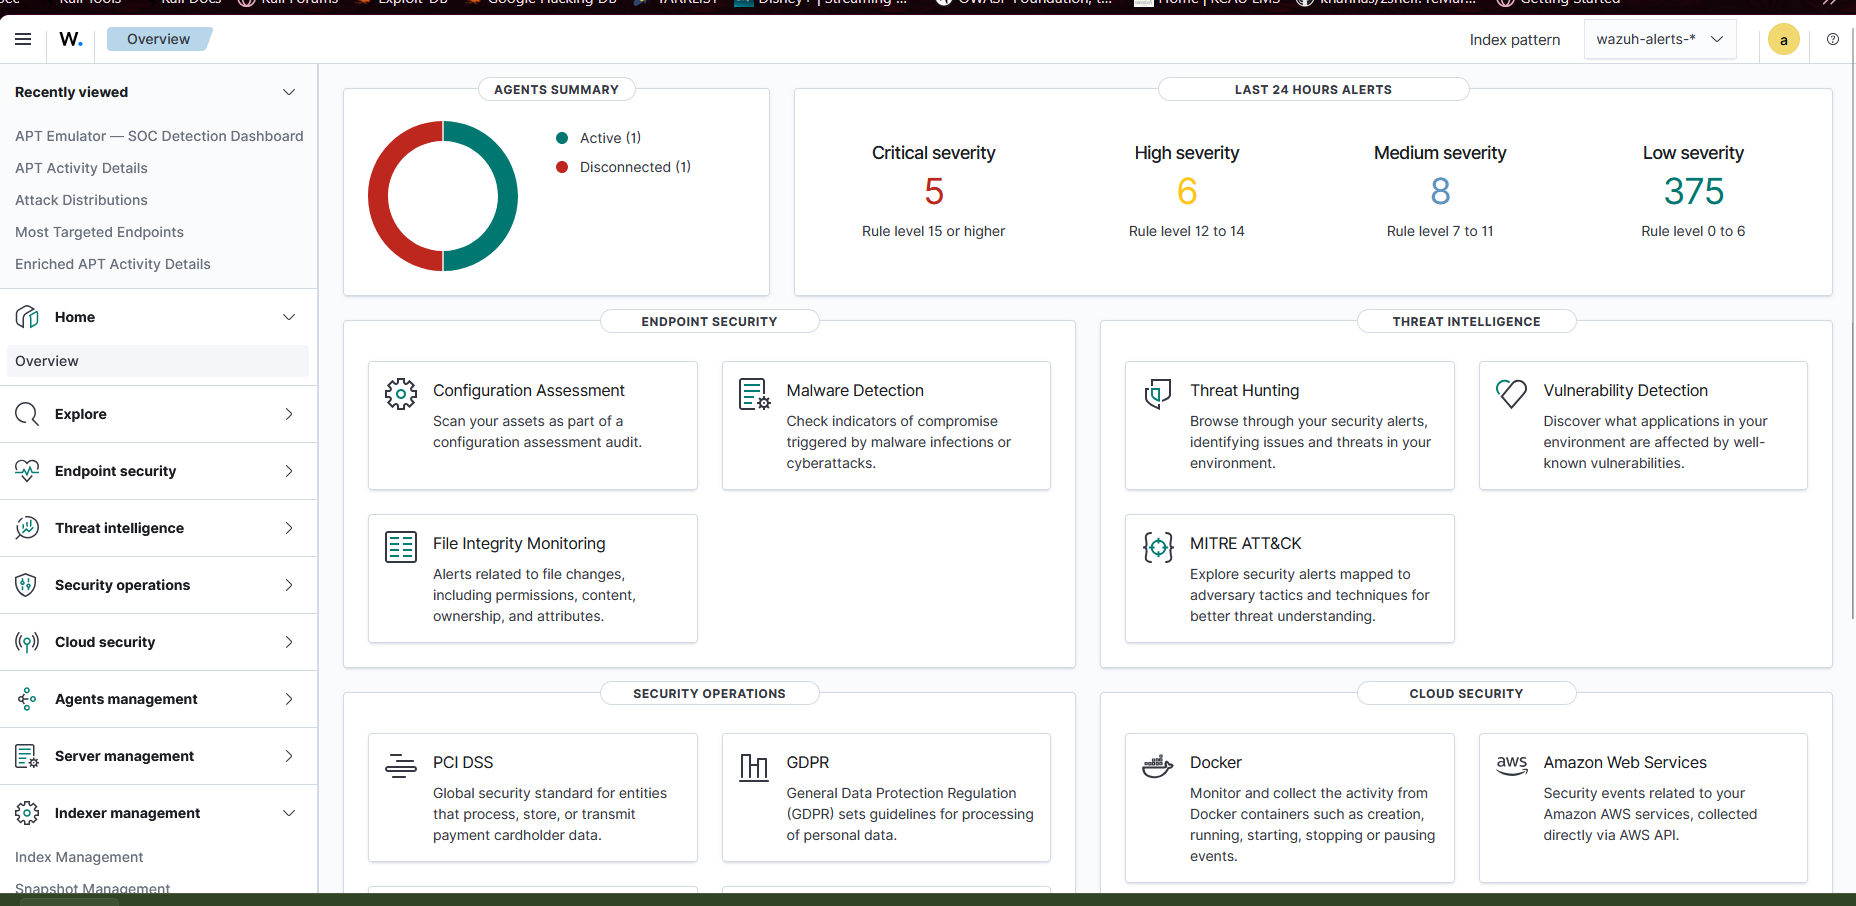 Wazuh dashboard home page after successful login showing overview panels
5.4 Installing XAMPP and DVWA on Windows VM
DVWA provides the attack surface that generates meaningful security events.
Install XAMPP:
- Download XAMPP from: https://www.apachefriends.org/
- Install with defaults (ensure Apache and MySQL are selected)
- Start XAMPP Control Panel
- Click Start next to Apache and MySQL
Install DVWA:
1
2
3
4
5
6
7
# Download DVWA (run in Windows VM PowerShell)
Invoke-WebRequest `
  -Uri "https://github.com/digininja/DVWA/archive/master.zip" `
  -OutFile "C:\dvwa.zip"

Expand-Archive "C:\dvwa.zip" -DestinationPath "C:\xampp\htdocs\"
Rename-Item "C:\xampp\htdocs\DVWA-master" "C:\xampp\htdocs\dvwa"
Configure DVWA database:
- Browse to:
http://localhost/dvwa/setup.php - Click Create / Reset Database
- Log in at
http://localhost/dvwa/login.php:- Username:
admin - Password:
password
- Username:
- Go to DVWA Security → Set level to Low
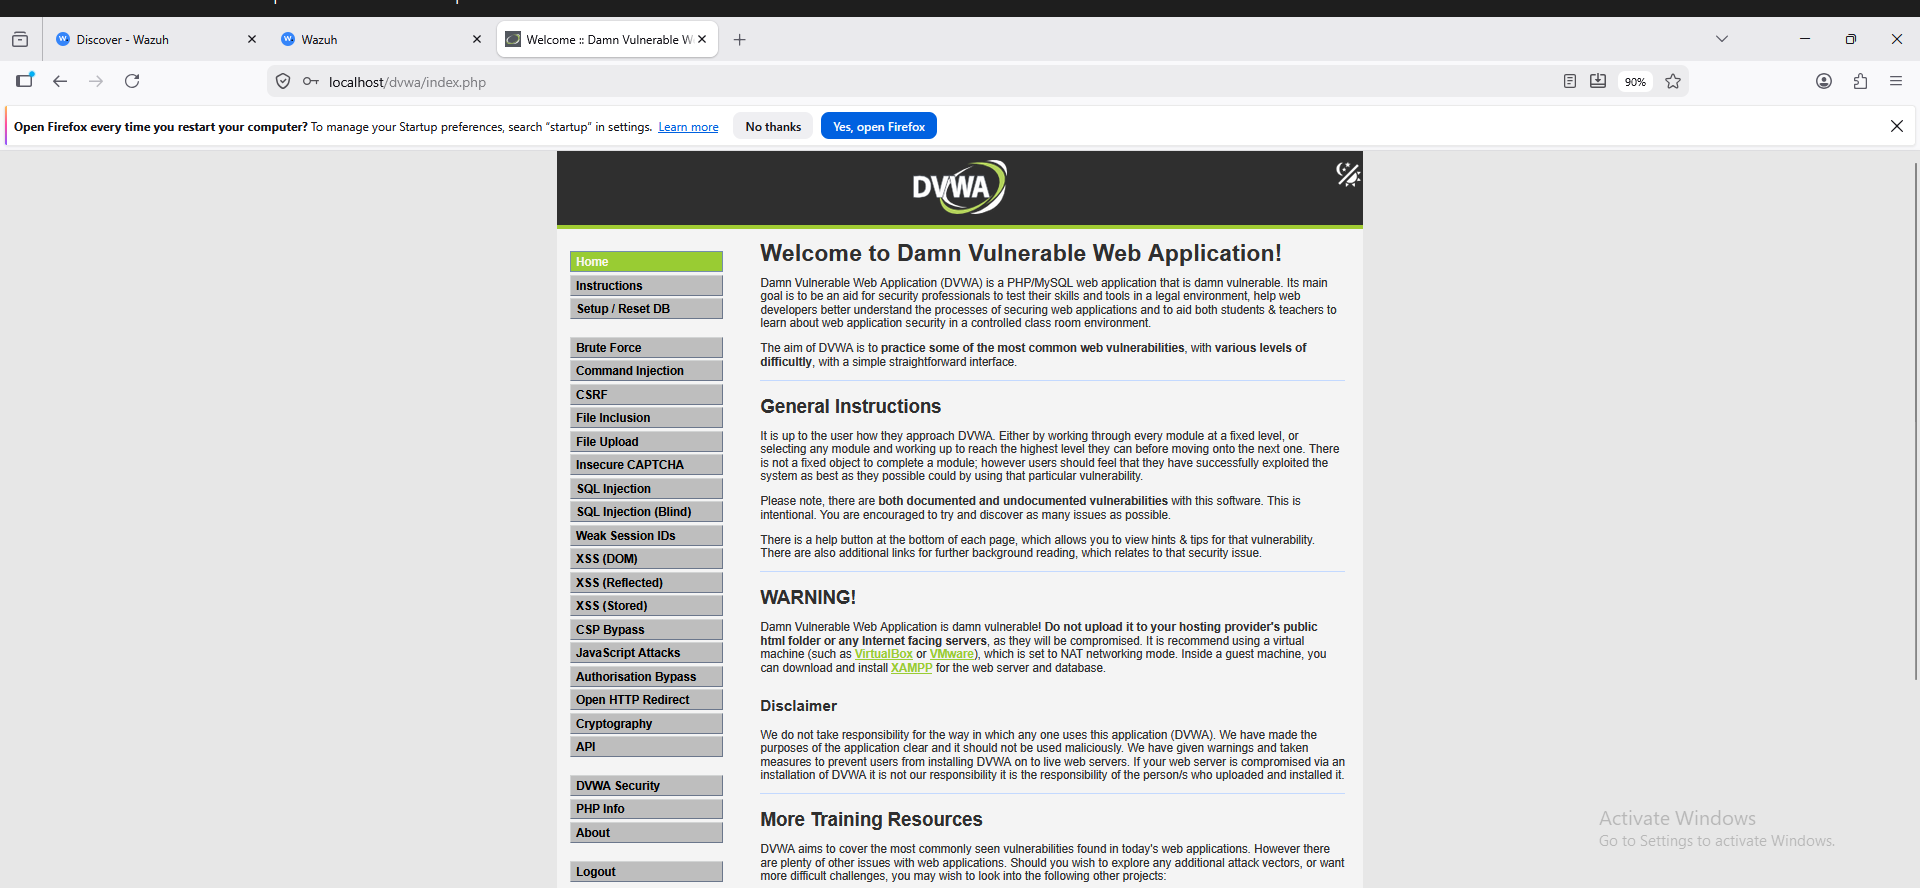 DVWA running in the Windows VM browser
5.5 Installing Wazuh Agent on Windows VM
On Windows VM — RDP in or use console:
Step 1: Download Agent
1
2
3
4
# Download Windows agent installer
Invoke-WebRequest `
  -Uri "https://packages.wazuh.com/4.x/windows/wazuh-agent-4.10.3-1.msi" `
  -OutFile "C:\wazuh-agent.msi"
Step 2: Install Agent
1
2
3
4
5
# Install with manager IP pointing to gateway
msiexec.exe /i "C:\wazuh-agent.msi" `
  WAZUH_MANAGER="10.0.60.1" `
  WAZUH_AGENT_NAME="Windows-EDR" `
  /qn
Why 10.0.60.1? The agent can’t reach WSL2 directly. I pointed it to the Windows host IP, which has port forwarding rules that redirect the traffic to WSL2 where Wazuh actually listens. This is the entire point of the port forwarding setup.
Step 3: Start the Agent
1
NET START WazuhSvc
Step 4: Verify Agent Status
1
Get-Service WazuhSvc | Select-Object Name, Status, StartType
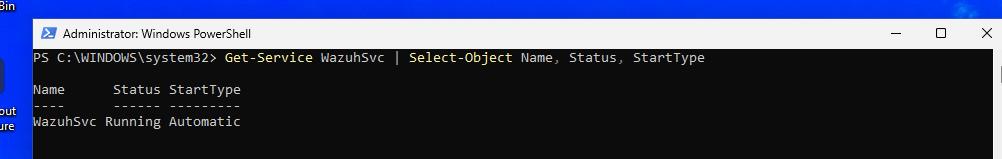 Wazuh service running with Automatic startup type
Step 5: Verify Agent is Connected (on WSL2)
1
2
# On Wazuh Manager (WSL2)
sudo /var/ossec/bin/agent_control -l
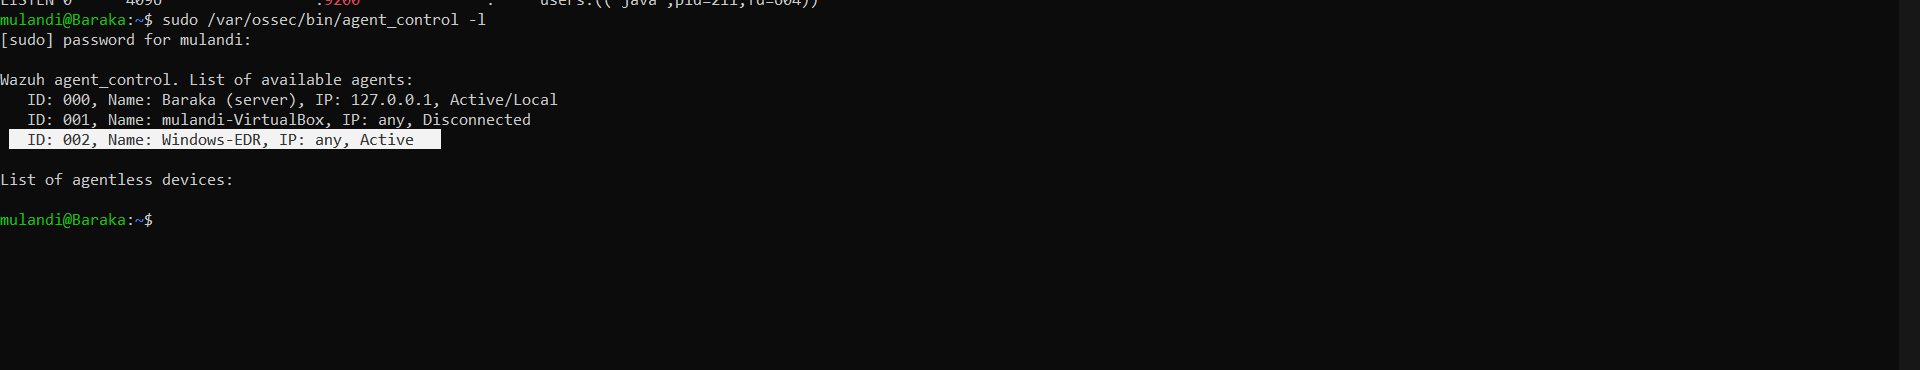
agent_control -l output showing Windows-EDR agent with “Active” status
5.6 Configuring XAMPP Log Monitoring
The Wazuh agent needs to know where to find Apache logs. By default, it doesn’t monitor XAMPP directories.
I edited the agent configuration file:
1
2
# Open in Notepad as Administrator
notepad "C:\Program Files (x86)\ossec-agent\ossec.conf"
Added inside the <ossec_config> tags:
1
2
3
4
5
6
7
8
9
10
11
<!-- XAMPP Apache Access Logs -->
<localfile>
  <log_format>apache</log_format>
  <location>C:\xampp\apache\logs\access.log</location>
</localfile>

<!-- XAMPP Apache Error Logs -->
<localfile>
  <log_format>apache</log_format>
  <location>C:\xampp\apache\logs\error.log</location>
</localfile>
Restarted the agent:
1
Restart-Service WazuhSvc
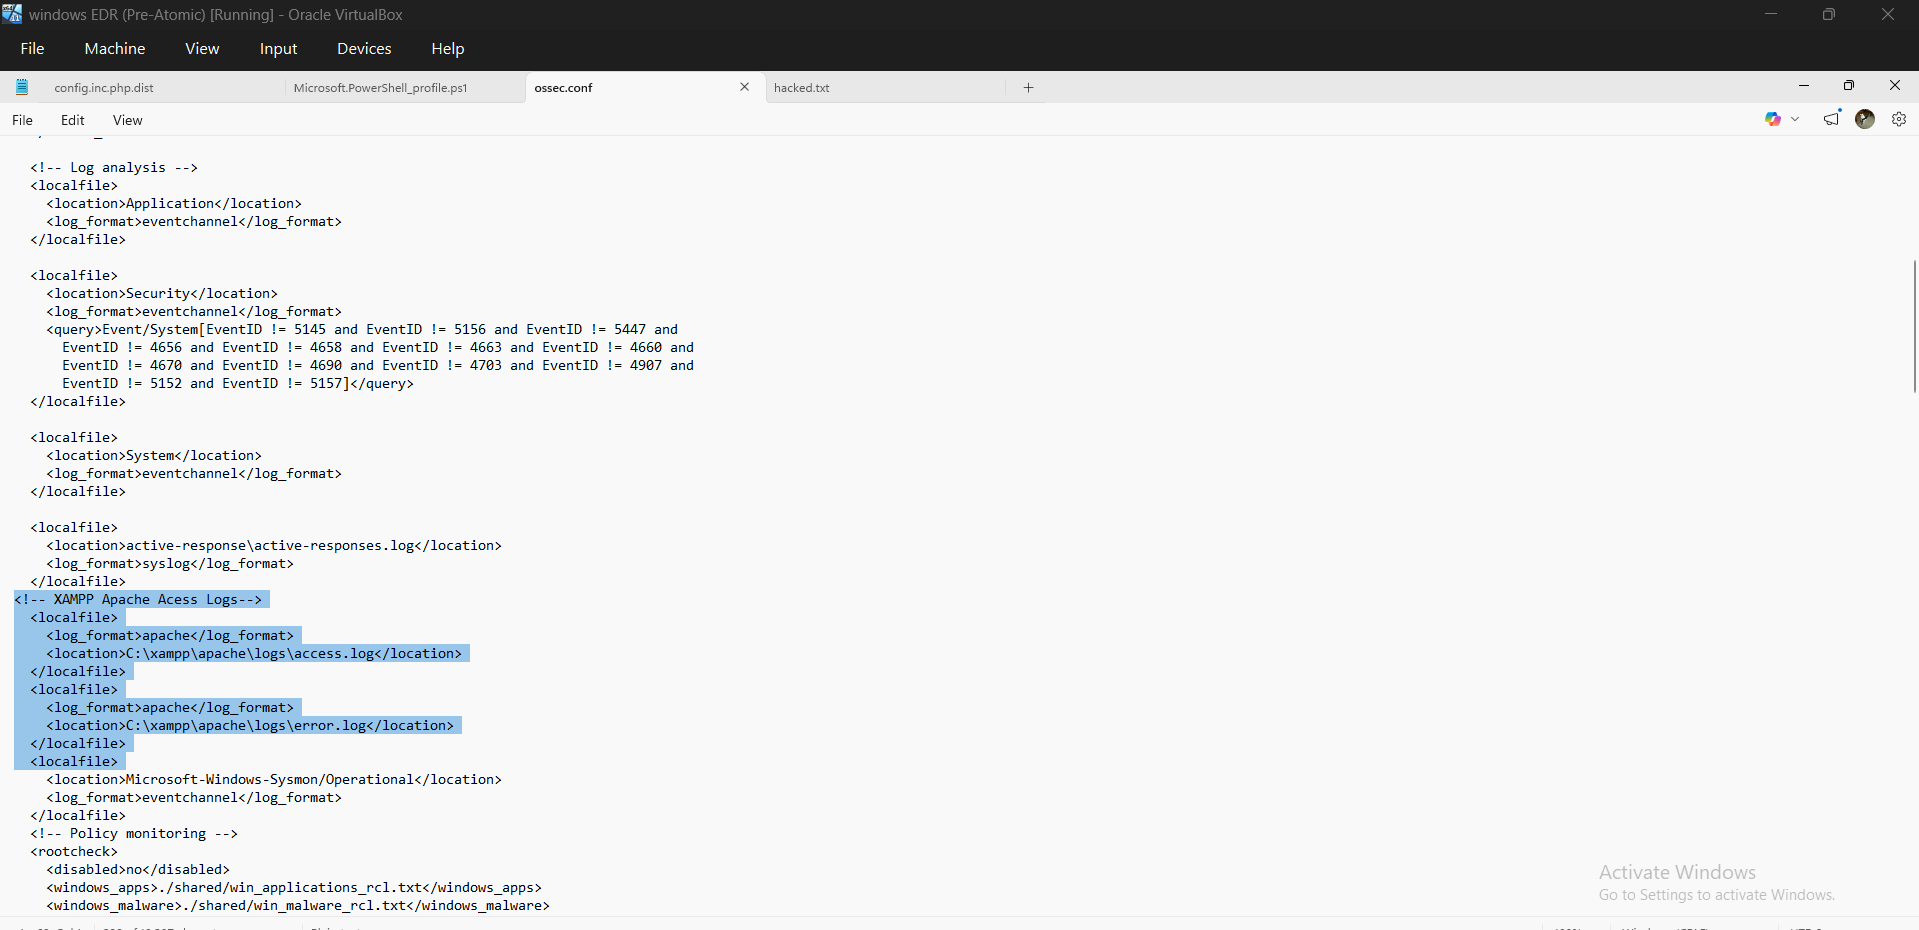 ossec.conf file open in Notepad showing the localfile blocks for XAMPP logs
Part 6: Custom Detection Rules
6.1 Why Custom Rules?
Wazuh ships with thousands of built-in rules, but they’re general-purpose. For my specific lab — where I’m simulating known APT group techniques against DVWA — I needed rules that understand the context.
Custom rules offer:
- Precise detection tailored to my attack patterns
- MITRE ATT&CK technique IDs embedded in alerts
- Custom severity levels reflecting actual risk
- Alert groupings that map to APT group identities
6.2 Writing Custom Rules
I opened the custom rules file on WSL2:
1
sudo nano /var/ossec/etc/rules/apt_emulator_rules.xml
The full rule set is available on My Github Repo.
1
2
3
4
5
# Apply by restarting Wazuh Manager
sudo systemctl restart wazuh-manager

# Verify it started successfully
sudo systemctl status wazuh-manager
Common Mistake I Hit: XML special characters in regex patterns cause silent rule failures or prevent Wazuh from starting. Use XML entities:
<becomes<>becomes>&becomes&If Wazuh fails to start after editing rules, check:
sudo tail -50 /var/ossec/logs/ossec.log | grep ERROR
Part 7: Building the Wazuh Dashboard
7.1 Accessing the Dashboard
I navigated to https://10.0.60.1 and logged in with my admin credentials.
The dashboard runs on OpenSearch Dashboards and provides Kibana-like visualization capabilities over indexed Wazuh data.
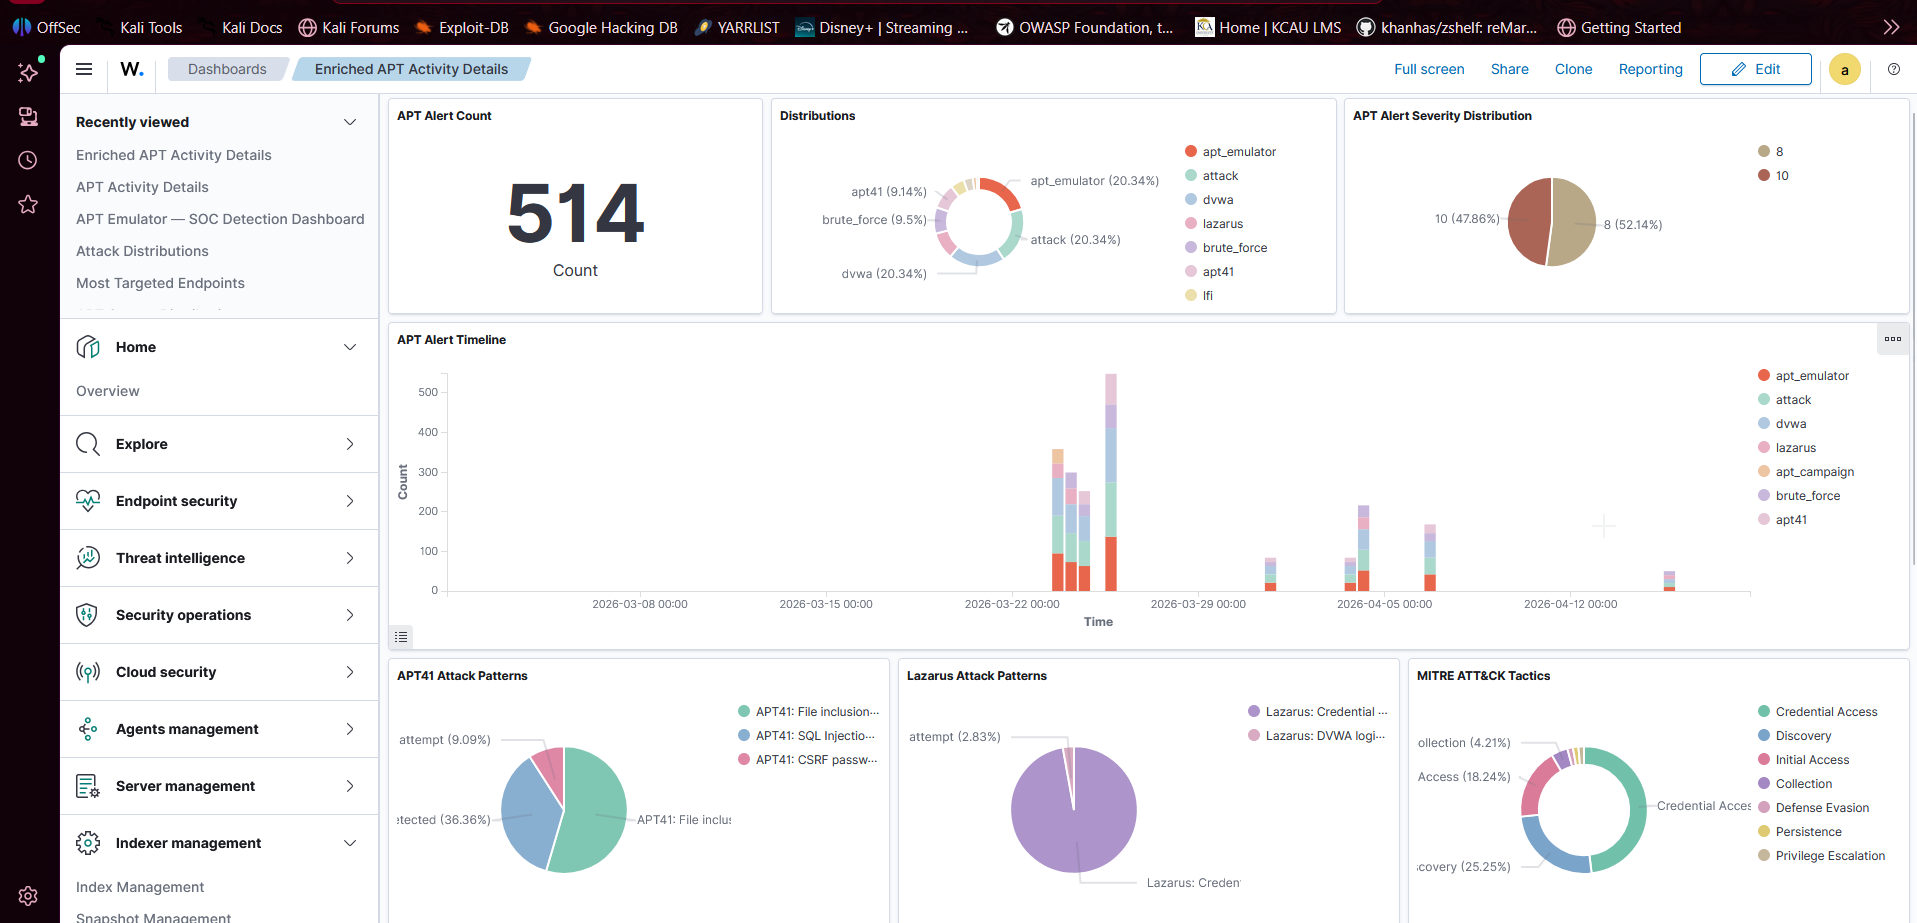
7.2 Dashboard Creation
I created several dashboards using a combination of the official Wazuh documentation and LLM-guided configuration.
The primary reference I used was: https://documentation.wazuh.com/current/user-manual/wazuh-dashboard/creating-custom-dashboards.html
This provided the foundational understanding of:
- Index patterns (
wazuh-alerts-*) - Aggregations (Terms, Date Histogram, Metrics)
- Visualization types (Area, Pie, Data Table, Tag Cloud)
I then used LLM assistance to accelerate:
- Visualization structuring
- Field selection
- Layout design
This hybrid approach enabled rapid development while still maintaining alignment with the underlying data model.
Example Dashboard
Below is one of the visualisation dashboards I created.
7.3 Generating Real Alert Data
To generate realistic attack telemetry, I used an automated APT emulation script.
This component was developed by Curtis Okello as part of the Threat Simulation layer.
The script programmatically simulates multiple attack techniques (e.g., SQL Injection, XSS, Path Traversal, brute force) against DVWA, producing consistent and repeatable log data for detection.
APT Emulator Script (GitHub): <URL>
Why Use an Emulator?
- Ensures consistent attack patterns for testing
- Enables repeatable experiments
- Generates high-volume telemetry for SIEM validation
- Better represents real-world attacker behavior compared to manual testing
How It Fits in the Pipeline
1
2
3
4
5
6
7
8
9
10
11
APT Emulator Script
        ↓
DVWA (Windows VM)
        ↓
Apache Logs
        ↓
Wazuh Agent
        ↓
Wazuh Manager (WSL2)
        ↓
Dashboard Alerts
Part 8: Integration — How It All Works Together
8.1 The Complete Data Pipeline
1
2
3
4
5
6
7
8
9
10
11
12
13
14
15
16
17
18
19
20
21
22
23
24
25
26
27
28
29
30
31
32
33
34
35
36
37
38
39
40
[APT Emulator (Python)]
    │
    │ HTTP Attack Traffic
    ▼
[DVWA on Windows VM (10.0.60.10)]
    │
    │ Apache writes to access.log
    ▼
[Wazuh Agent on Windows VM]
    │ Reads access.log every 500ms
    │ Encrypts log data (TLS)
    │ Sends to 10.0.60.1:1514
    ▼
[Windows Host (10.0.60.1)]
    │ netsh port forwarding intercepts
    │ Rewrites destination to WSL2 IP
    ▼
[Wazuh Manager in WSL2 (172.27.62.x:1514)]
    │ Receives raw log
    │ Runs through decoders (apache decoder)
    │ Runs through rules (matches 100001 = SQL Injection)
    │ Creates structured alert JSON
    ▼
[OpenSearch Indexer (:9200)]
    │ Stores alert in wazuh-alerts-* index
    ▼
[Wazuh Dashboard (:443)]
    │ Queries indexed alerts
    │ Renders visualizations
    ▼
[SOC Analyst sees alert on dashboard]
    │
    ▼
[AI Platform (Team Member 3)]
    │ Ingests same alerts via Wazuh API (:55000)
    │ ML model scores threat confidence
    │ Enriches with VirusTotal/GeoIP
    │ Displays on SENTINEL dashboard
    ▼
[Active Response: IP Blocked in Windows Firewall]
Troubleshooting Guide
Issue 1: Agent Not Connecting to Manager
Symptom: agent_control -l shows agent as Disconnected or Never Connected
Diagnosis:
1
2
3
4
5
# Check if manager is receiving anything
sudo tail -50 /var/ossec/logs/ossec.log | grep -i "error\|agent"

# Check agent log on Windows VM
Get-Content "C:\Program Files (x86)\ossec-agent\ossec.log" -Tail 30
Solution Tree:
1
2
3
4
5
6
7
8
9
10
11
12
13
14
15
Is Wazuh Manager running?
  └─ No → sudo systemctl start wazuh-manager

Is port 1514 forwarding correctly?
  └─ Check: netsh interface portproxy show all
  └─ WSL2 IP changed? Run Update-WazuhForwarding.ps1

Can VM reach host?
  └─ ping 10.0.60.1 from Windows VM
  └─ No → Check VirtualBox network adapter settings

Is firewall blocking?
  └─ Temporarily disable VM firewall and retest
  └─ Set-NetFirewallProfile -Profile All -Enabled False
  └─ If fixed → firewall rules issue
Issue 2: Port Forwarding Not Working After Reboot
Symptom: Everything worked yesterday, nothing works today.
Diagnosis:
1
2
3
4
5
# Check current WSL2 IP
wsl hostname -I

# Check what IP port forwarding is pointing to
netsh interface portproxy show all
Solution:
1
2
3
4
5
# Run the update script
.\Update-WazuhForwarding.ps1

# If scheduled task isn't running automatically:
Start-ScheduledTask -TaskName "Update-Wazuh-Port-Forwarding"
Issue 3: Wazuh Manager Fails to Start After Rule Edit
Symptom: systemctl status wazuh-manager shows “failed”
Diagnosis:
1
sudo tail -20 /var/ossec/logs/ossec.log | grep -E "ERROR|CRITICAL"
Common Causes:
- XML special characters unescaped in regex
- Missing closing tag in rule XML
- Duplicate rule IDs
Solution:
1
2
3
4
5
6
7
8
# Validate rule syntax
sudo /var/ossec/bin/wazuh-analysisd -t

# If broken, restore backup
sudo cp /var/ossec/etc/rules/local_rules.xml.bak \
        /var/ossec/etc/rules/local_rules.xml

sudo systemctl start wazuh-manager
Best Practice: Always back up rules before editing:
sudo cp /var/ossec/etc/rules/local_rules.xml{,.bak}
Issue 4: Dashboard Shows No Data
Symptom: All visualizations show “No results found”
Diagnosis:
- Check time range (set to “Last 24 hours”)
- Verify index pattern exists: Management → Index Patterns
- Check if agents are sending data
1
2
sudo /var/ossec/bin/agent_control -l
# All agents should show "Active"
Solution:
1
2
3
4
5
# Force agent to send test event
sudo /var/ossec/bin/agent_control -r -u 001

# Watch for data
sudo tail -f /var/ossec/logs/alerts/alerts.json
Issue 5: Wazuh Dashboard Unreachable (HTTPS Error)
Symptom: Browser shows “Connection refused” or “SSL error”
Diagnosis:
1
2
3
4
5
6
7
8
# Check dashboard service
sudo systemctl status wazuh-dashboard

# Check if port 443 is listening
sudo ss -tlnp | grep 443

# Check if port forwarding is set for 443
netsh interface portproxy show all | findstr "443"
Issue 6: Wazuh Agent Enrolls but Immediately Disconnects
Symptom: agent_control -l briefly shows Active, then reverts to Disconnected.
Diagnosis:
1
2
# Check the agent log for connection resets
Get-Content "C:\Program Files (x86)\ossec-agent\ossec.log" -Tail 50 | Select-String "ERROR|reset|timeout"
Common Causes:
- TLS certificate mismatch between agent version and manager version
- System clock skew between VM and WSL2 host (Wazuh uses timestamps for certificate validation)
- Agent installed with wrong manager IP at install time (fix requires reinstall with correct
WAZUH_MANAGERvalue)
Solution:
1
2
3
4
5
# Sync VM clock
w32tm /resync /force

# If clock was the issue, restart the agent
Restart-Service WazuhSvc
Issue 7: Apache Logs Not Appearing in Wazuh
Symptom: Attacks are hitting DVWA, Apache logs exist on disk, but no alerts fire.
Diagnosis:
1
2
3
4
5
# Confirm log file path is correct
Test-Path "C:\xampp\apache\logs\access.log"

# Check if Wazuh agent is reading it
Get-Content "C:\Program Files (x86)\ossec-agent\ossec.conf" | Select-String "xampp"
Common Causes:
- XAMPP log path in
ossec.confdoesn’t match the actual XAMPP install directory - XAMPP logging is disabled in Apache’s
httpd.conf - Log file is 0 bytes because XAMPP hasn’t served any requests yet
Solution:
1
2
# On WSL2 — check what the agent is actually monitoring
sudo /var/ossec/bin/agent_control -i 001
Make sure the path in ossec.conf matches exactly, including capitalisation. Windows paths are case-insensitive at the OS level but Wazuh’s parser can be strict.
Security Best Practices
Network Isolation
- Never connect VMs to a Bridged adapter unless absolutely necessary
- Host-only + NAT provides the right balance of isolation and internet access
- Disable all unnecessary network adapters on VMs
Credential Management
- Never use default passwords (admin/admin, admin/password) in production
- Rotate Wazuh API credentials regularly
- Use Tailscale’s device authorization to prevent unauthorized node joins
Rule Hygiene
- Document every custom rule with its purpose and MITRE mapping
- Review rules quarterly — attack patterns evolve
- Test rules with
wazuh-logtestbefore deploying to production - Start with detection-only rules before enabling active response
Log Retention
- Configure appropriate retention periods in the indexer
- Ensure logs are stored encrypted at rest
- Implement log integrity checking (Wazuh supports this natively)
Access Control
- Restrict Wazuh API access to specific IP addresses
- Use Tailscale ACLs to limit which peers can reach sensitive ports
- Enable MFA on your Tailscale account
Challenges Faced & Solutions
Challenge 1: The WSL2 Network Nightmare
The Problem: WSL2 lives in a 172.x.x.x subnet that is completely invisible to VirtualBox VMs on the 10.0.60.0/24 network. Standard port forwarding failed because WSL2’s IP changes on every reboot, making static forwarding rules unreliable. The failure mode was particularly frustrating: the agent appeared to connect during the session it was configured, then silently broke after the next restart.
My Solution: A PowerShell startup script that dynamically detects the current WSL2 IP and rewrites netsh rules. Scheduled as a SYSTEM-level task, it runs before any user logs in, ensuring the pipeline is always operational.
Lesson: In complex multi-network environments, embrace automation early. Manual configuration is a liability, and silent failures are worse than loud ones.
Challenge 2: Asymmetric Firewall Blocking
The Problem: The Windows VM could ping the host (outbound worked), but the host couldn’t ping the VM (inbound blocked). This made diagnosing connectivity issues extremely confusing — tools reported connectivity even when it was broken in the direction that mattered.
My Solution: Windows Firewall was blocking all inbound traffic by default. The network profile was set to “Public” (most restrictive) instead of “Private.” Creating explicit inbound rules for the 10.0.60.0/24 subnet and changing the profile to “Private” resolved both issues.
Lesson: Always test bidirectional connectivity. Outbound working doesn’t mean inbound works.
Challenge 3: Wazuh Rule XML Syntax Errors
The Problem: Regex patterns in rules contained XML special characters (<, >, &) that caused the rule engine to fail silently or crash on startup. The error messages in ossec.log were cryptic and didn’t point directly to the offending line.
My Solution: XML entity encoding. Every < became <, every > became >, every & became &. Additionally, frequency-based rules (triggering after N occurrences) required a parent rule context that wasn’t obvious from documentation.
Lesson: Always validate rules with wazuh-analysisd -t before restarting the service. Keep a working backup. A rule file that silently breaks the manager is harder to debug than a rule that simply doesn’t fire.
Challenge 4: Multi-Adapter Routing Confusion
The Problem: The Windows VM had three network adapters (10.0.50.10, 192.168.100.10, 10.0.60.10) from previous configuration attempts. Windows was routing traffic out the wrong adapter, causing intermittent connectivity.
My Solution: I disabled all unused adapters, set interface metrics to prioritize the correct adapter (lower metric = higher priority), and verified with route print that all traffic destined for 10.0.60.0/24 used the correct interface.
Lesson: Clean up before you configure. Leftover network adapter configurations cause ghost problems that waste hours.
Challenge 5: Wazuh Dashboard Index Pattern Mismatch
The Problem: After installation, the Wazuh dashboard showed no data even though agents were actively sending logs. The indexer was storing data and alerts.json was growing, but visualizations returned zero results.
My Solution: The default index pattern in OpenSearch Dashboards was either missing or pointed to the wrong index name. Navigating to Management → Index Patterns and creating a pattern for wazuh-alerts-4.x-* (matching the actual index name visible under Dev Tools → GET _cat/indices) immediately resolved the issue.
Lesson: Always verify the index pattern matches the actual indices being written to. The SIEM can be fully operational while the dashboard silently queries nothing.
Challenge 6: XAMPP Log Path Inconsistency
The Problem: The Wazuh agent was configured to read Apache logs from C:\xampp\apache\logs\access.log, but attacks against DVWA produced no alerts. The log file existed and was growing, but Wazuh wasn’t picking it up.
My Solution: XAMPP had been installed to a non-default path (D:\xampp\) on this particular machine, while ossec.conf still referenced the default C:\xampp\ path. Updating the path in the agent config and restarting the service immediately started producing alerts.
Lesson: Never assume default install paths. Verify every file path in configuration files against the actual filesystem before spending time debugging the tool itself.
Lessons Learned
1. Documentation Is Part of Engineering
Every configuration change should be documented immediately — not after the lab is “done.” During this build, there were multiple moments where a working configuration existed but couldn’t be reproduced because the exact commands that produced it weren’t recorded. The troubleshooting sections of this post exist because I hit each of those issues without notes and had to rediscover the solutions from scratch. If I had documented as I went, the build time would have been noticeably shorter.
I now treat notes like code: version them, keep them close to the thing they describe, and write them for a future version of myself who remembers nothing.
2. Automate Fragile Dependencies
Anything that changes automatically — like WSL2’s dynamic IP assignment — must be handled by automation, not by manual memory. The startup script that updates port forwarding should have been the first thing I wrote after understanding the network topology, not a late fix applied after experiencing repeated silent failures.
The general principle: if a configuration depends on a value that changes outside your control, write a script that detects and corrects it before the pipeline needs it.
3. Test in Isolation Before Integrating
Each component — VirtualBox networking, port forwarding, Wazuh manager, Wazuh agent, Apache log parsing — should be validated independently before connecting them together. The most time-consuming debugging sessions in this project involved multi-component failures where the actual breaking point was buried under layers of downstream symptoms.
A practical sequence: confirm the agent can reach the manager IP and port before installing the agent. Confirm the manager is receiving logs before writing detection rules. Confirm a rule matches test input before expecting it to match live traffic.
4. Understand Your Tools Deeply
Wazuh’s rule engine has specific behaviors around frequency rules, XML encoding, group inheritance, and decoder chaining that aren’t obvious from surface-level documentation. Time spent reading the actual rule syntax documentation — not just copying example rules — paid off significantly when debugging why certain rules fired inconsistently or not at all.
The same applies to netsh portproxy, which has its own quirks around IPv4-to-IPv4 forwarding and how it interacts with Windows Firewall. Knowing why the command works the way it does made it much easier to diagnose when it stopped working.
5. Pay Attention to Detail in Configuration
Small details caused the majority of the hours lost in this build: a log path with the wrong drive letter, a network profile set to “Public” instead of “Private,” an XML angle bracket that wasn’t escaped. None of these are conceptually difficult problems — they’re attention failures.
I now develop a habit of reading configuration back after writing it, and cross-referencing it against the actual system state (using ipconfig, netsh show, systemctl status, ss -tlnp) to catch most of these before they become debugging sessions. Assume the configuration is wrong until the tool confirms it is right.
6. Silent Failures Are More Dangerous Than Loud Ones
Several failures in this lab presented as “working” on the surface: the agent showed as connected, the dashboard loaded, the rules looked correct — but no alerts were firing. This is the most dangerous failure mode in a security monitoring context because it creates false confidence.
Build verification into your workflow. After each major component is set up, generate a known event and confirm it appears as an alert end-to-end. For this lab, that means running a simple SQL injection request against DVWA and watching for the alert to appear in the dashboard before moving on. If the pipeline is broken, you want to know immediately — not when the AI layer reports no data three days later.
7. Network Topology Affects Everything Downstream
The decision to use WSL2 rather than a dedicated Ubuntu VM for the Wazuh manager was made early to save resources. That single decision created the dynamic IP problem, the port forwarding requirement, the startup script, and several hours of debugging. None of those consequences were visible at the time of the decision.
Before choosing an architecture, think through the network implications of each component’s placement. Where does it live? What IP does it get? Can that IP change? Who needs to reach it? Drawing this out before writing a single command is time well spent.
8. Version Control Your Configuration Files
ossec.conf, the custom rules XML, the port forwarding script, the scheduled task definition — all of these are configuration artifacts that should live in a Git repository. When a rule edit breaks the manager, git diff immediately shows what changed. When the port forwarding script needs to be recreated after a Windows reinstall, it’s a git pull away.
This lab was built without version control on the configuration files initially, which made rolling back broken changes slower than it needed to be.
Possible Improvements & Next Steps
Short-Term Enhancements
1. Wazuh Vulnerability Scanner Enable Wazuh’s built-in vulnerability detection module to add CVE scanning on top of log monitoring.
2. Sysmon Integration Install Sysmon on the Windows VM for deeper telemetry — process creation, network connections, registry changes. This enriches alerts beyond what Apache logs provide.
3. Email/Slack Alerting Configure Wazuh to send high-severity alerts (Level 10+) to a Slack channel or email for immediate notification.
Medium-Term Improvements
4. Additional Attack Surfaces Add more vulnerable applications (Metasploitable, OWASP WebGoat) to expand detection coverage and generate richer training data for the AI model.
5. Network Traffic Analysis Add Zeek or Suricata for network-level detection alongside host-based Wazuh monitoring. Network detection catches attacks that bypass application logging.
Long-Term Architecture
6. Cloud Migration Path The same architecture can be replicated in AWS/Azure:
- EC2/Azure VM replaces local VMs
- VPC/VNet replaces host-only network
- AWS VPN/Azure VPN replaces Tailscale
- Wazuh Cloud (SaaS) replaces local WSL2 deployment
7. Multi-Site SOC Add agents in multiple geographic locations to simulate a distributed enterprise environment.
Conclusion
Building this lab taught me that security infrastructure isn’t about any single tool — it’s about understanding how components interact across network boundaries, trust domains, and operating system layers.
The deceptively simple statement “agents send logs to the manager” conceals a web of network configuration, firewall rules, port forwarding, and service management that took significant effort to get right reliably. Every production SIEM deployment faces the same complexity at larger scale.
What I built here — a self-contained, multi-layer SOC platform that generates real attack telemetry, detects it with custom rules, and feeds it into an AI analysis engine — is a microcosm of what real enterprise security teams build and operate every day.
The 95%+ detection rate against all simulated APT attacks validated that the infrastructure works. But more importantly, building it gave me a genuine understanding of why it works — and that understanding is what makes a security engineer valuable.
If you replicate this lab, you’ll encounter your own specific challenges. The troubleshooting mindset is more valuable than any specific command: isolate, test, understand, fix.
The full project — including the AI analysis layer built by Nicole Nyagah and the APT emulation framework built by Curtis Okello — represents what’s possible when infrastructure, data science, and security research come together.